

A fast website needs more than a score from a testing tool. It needs someone to find the cause, fix the issue, and track the result. Here are the best website speed optimization SEO services and tools, with the right pick for business owners, marketers, and developers.
1. SearchX: Managed Website Speed Optimization SEO
SearchX is a managed SEO service that connects website speed work with broader search growth. It’s best for service businesses, e-commerce brands, healthcare companies, legal firms, and multi-location operators that need more than raw performance data.
Most speed tools tell you that a page has a slow Largest Contentful Paint, poor Interaction to Next Paint, or layout shifts. SearchX offers a strategic, business-level speed solution rather than just raw data.
That matters when the problem sits across several parts of a site. A large hero image may delay the main content. A script from a third-party service may slow interaction. A template change may affect hundreds of location or product pages at once. A managed team can trace those links instead of treating each score as an isolated fault.
We also keep the work visible through reporting and ongoing review. You can see what was found, what needs a developer, and which fixes should move first. Our technical SEO services include page speed work as part of a wider search plan.

| Best fit | What you get | Watch for |
|---|---|---|
| Business owners | A team that connects speed fixes with SEO goals | You’ll need access to your site team or developer |
| Growing e-commerce sites | Prioritized work across templates and key pages | Large catalogs need clear page groups |
| Multi-location operators | Site-wide review with attention to repeated layouts | Location templates may need separate testing |
| In-house marketing teams | Clear findings for developer handoff | Results depend on implementation speed |
The limitation is simple: SearchX isn’t a push-button score checker. It works best when you want a partner to turn performance data into a plan. If you only need to test one page, start with a free testing tool. If speed affects revenue across your site, SearchX is the stronger choice.
2. PageSpeed Insights: Fast Page-Level Performance Testing
PageSpeed Insights is a browser-based testing tool for checking page performance. It’s best for site owners who need a quick view of one URL before handing findings to a developer or SEO team.
The tool is useful because it brings field data and lab data into one report when data is available. Field data reflects visits from real Chrome users. Lab data gives a repeatable test environment that helps you compare changes on the same page.
Its Core Web Vitals view focuses on LCP, INP, and CLS. LCP measures when the main content appears. INP looks at how quickly a page responds to user actions. CLS measures unexpected movement on the page. These metrics can also appear in Search Console and related tools.
PageSpeed Insights is also a useful first step for a campaign. Test a service page, a product page, and a key landing page. Then group the findings by cause instead of treating every URL as a separate project. A site with one slow template may have the same issue across many pages.
SearchX’s guide to testing Core Web Vitals with free tools can help teams build that first review without paying for a separate platform.
There is a clear limit. PageSpeed Insights reports problems, but it doesn’t repair your code, resize your images, remove a blocking script, or change your hosting setup. Use it to find the first problem. Use a developer or SEO service to fix the cause and check the result.
3. Chrome Lighthouse: Technical Audits for Developers
Chrome Lighthouse is an auditing tool for developers who need a deeper look at a page during development. It fits teams that can inspect code, test changes, and act on technical findings without waiting for a separate service.
Lighthouse runs audits in a controlled environment. That makes it useful when you need to compare a page before and after a code change. A developer can test a new script, a layout change, or a different image format and then inspect the effect on page performance.
The report gives more than one headline score. It points toward issues such as render-blocking resources, large page assets, and inefficient loading behavior. The exact findings depend on the page and test conditions, so one run shouldn’t become a permanent verdict.
Use Lighthouse during the build cycle. A developer can test a page on a local build before it reaches production. After release, the team can compare that result with field data from actual visitors. This split helps prevent a common mistake: assuming a clean lab score means every visitor gets the same experience.
The tool’s weakness is the handoff. A Lighthouse report can list many possible fixes, but it doesn’t decide which one affects leads or sales first. A small business may need help turning technical findings into a short work queue. An agency can connect the audit to page value, search intent, and conversion paths.
Lighthouse is a strong development tool. It isn’t a managed website speed optimization SEO service, and it doesn’t include a built-in fix team or CDN. Keep it close to the codebase, then use field data to judge the page after release.
4. Chrome User Experience Report: Real-User Performance Data
Chrome User Experience Report, often called CrUX, supplies anonymized performance data from real Chrome users. It’s best for teams that want to see how visitors experience a site without adding custom measurement code first.
CrUX focuses on the Core Web Vitals metrics. That makes it different from a single lab run. A lab test shows what happened in one controlled session. Field data can reveal a slower pattern across devices, networks, and locations.
The data can answer questions that a developer’s laptop cannot. Do mobile visitors see a slower main image? Does a page respond poorly for users on weaker connections? Does a layout shift happen after a late ad or widget loads? These questions help teams choose fixes that affect actual users.
CrUX provides anonymized real-user measurement data for each Core Web Vital. It can be used alongside tools such as PageSpeed Insights and Search Console, which use the data in different ways.
CrUX has limits. It doesn’t explain the exact line of code that caused a slow result. It also won’t tell you every page’s performance when a URL lacks enough field data. Treat it as a signal about user experience, not a complete debugging report.
For SEO teams, CrUX is most useful when paired with page groups. Compare product templates with category templates. Compare service pages with location pages. Then send the worst pattern to a developer or managed SEO team for diagnosis. Data tells you where to look. It doesn’t do the repair.
5. web-vitals JavaScript Library: Custom Measurement for Developers
The web-vitals JavaScript library lets developers measure Core Web Vitals through standard web APIs. It’s best for teams that need performance data inside their own analytics or reporting system.
The library can measure LCP, INP, CLS, and other web performance signals through JavaScript. A developer can call the measurement function and send the result to an analytics endpoint. That creates a direct path between a page visit and a team’s internal dashboard.
This approach works well when a company wants to split data by page type, device class, logged-in state, or other business fields. For example, a product team might compare checkout performance with content page performance. A marketing team might track a campaign landing page after a new tag is added.
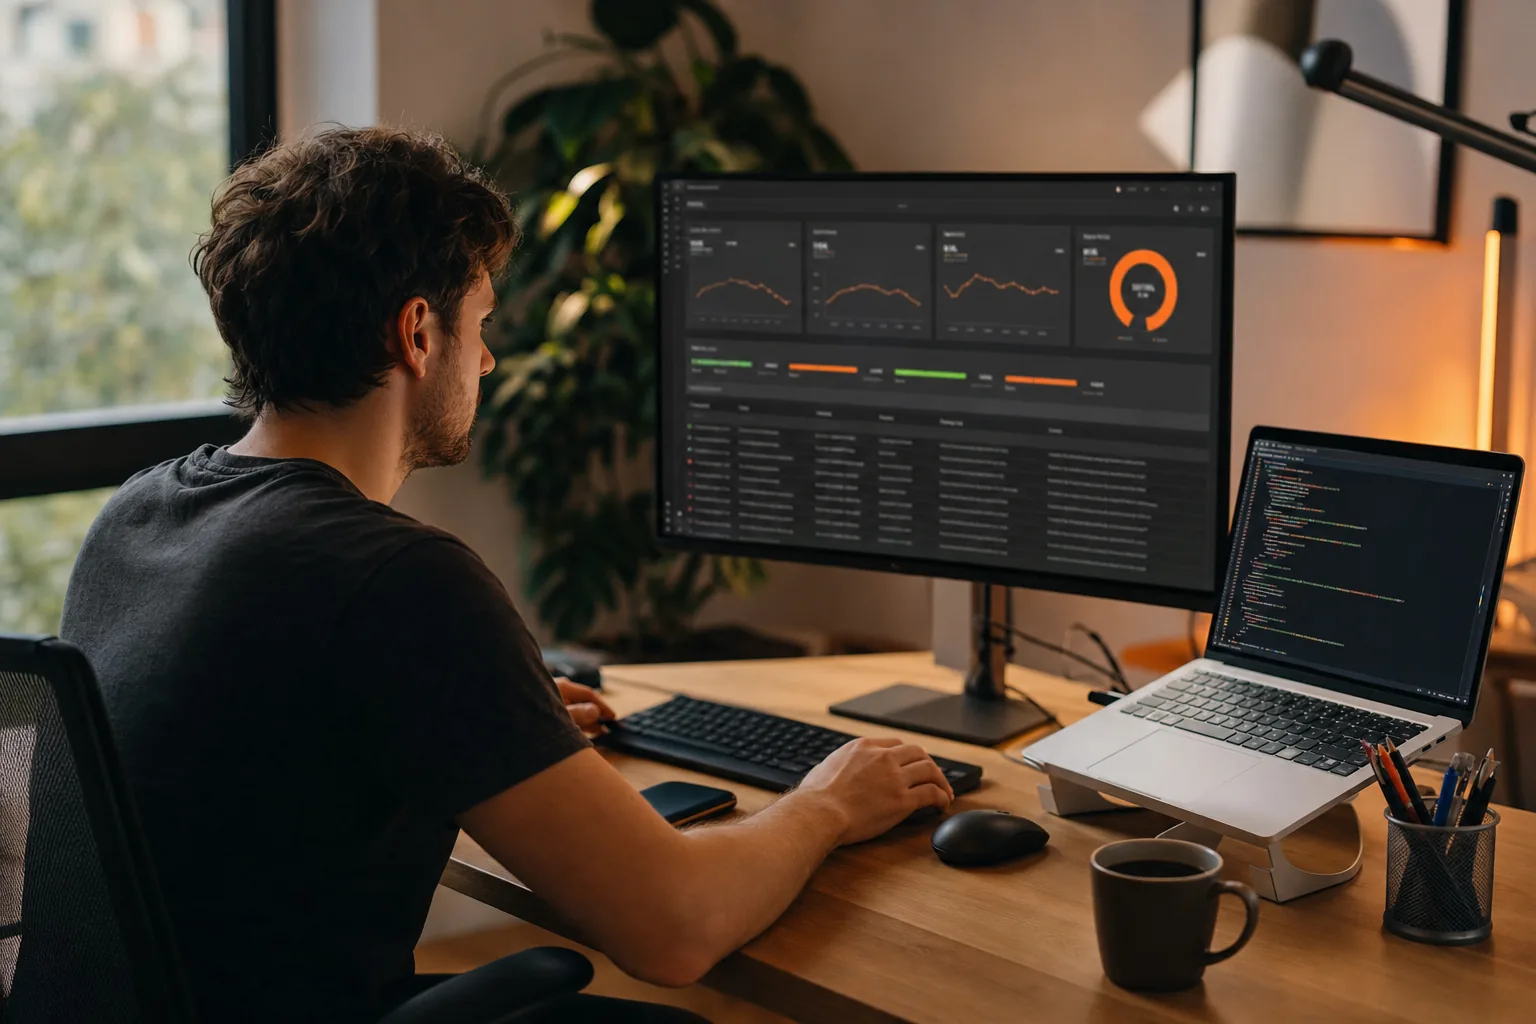
The tradeoff is the work needed to run it well. Someone must add the code, send the data to a safe endpoint, choose useful fields, and decide how the team will act on the results. Measurement can become noise if every metric enters a dashboard without an owner.
The library also measures. It doesn’t optimize your page. It won’t compress a hero image, remove a slow script, or fix a layout shift. Developers should pair it with release checks and a clear process for assigning fixes.
Choose this option when custom data matters. If you need a quick diagnosis, PageSpeed Insights is easier. If you need a managed plan that links performance with technical SEO, SearchX is better suited to the business side of the work.
6. Chrome DevTools: In-Browser Performance Debugging
Chrome DevTools gives developers a way to inspect performance inside the browser. It’s best for finding what happens during a page load, a click, a scroll, or a layout change.
DevTools helps connect a symptom to a browser event. A developer can inspect the network panel to see which files load first. The performance panel can show long tasks and timing gaps. The elements and styles panels can help explain why a layout moves after content appears.
That detail makes DevTools useful after a broader audit points to a problem. Suppose a page has poor INP. The team can record an interaction and look for a long task that blocks the main thread. Suppose CLS is poor. The team can watch which element shifts and trace the missing size or late-loaded content.
Chrome DevTools also includes Core Web Vitals data powered by the Chrome User Experience Report. This gives developers a browser-side view while they inspect the page itself.
DevTools is free and close to the code. Its limit is the skill needed to can show a long task, but a business owner still needs someone to decide whether the fix should affect a third-party tag, a page template, or a product feature.
Images are a common place to start. Large files can delay the main content, especially on mobile connections. Our guide to image optimization for faster page loads gives marketing teams a clearer handoff when image work sits outside their coding skills.
Use DevTools when you need proof of cause. Don’t use one browser trace as a substitute for field data across your full audience.
7. Search Console Core Web Vitals Report: Ongoing SEO Monitoring
The Search Console Core Web Vitals report helps site owners monitor performance trends across groups of URLs. It’s best for teams that want an ongoing view instead of a one-time test.
The report uses field data and groups pages by similar performance issues. That group view matters for large sites. If dozens of product pages share a template, a single technical fix may help the whole group. If only one URL has a problem, the work can stay narrow.
The report covers LCP, INP, and CLS. It can show whether a group has a good, needs improvement, or poor experience based on the available field data. Starting tracking begins a 28-day monitoring session, so teams should allow time before judging a new change.
Search Console is useful for the SEO owner because it sits beside search performance data. You can connect a page group with its search role, then decide if a slow template affects a high-value service or product page. That makes the work easier to rank by business impact.
It still won’t fix the site. The report can tell you that a group needs attention, but it doesn’t edit templates or coordinate a release. SearchX can help teams turn those findings into a managed technical SEO work plan. For sites using AMP, our guide to Google Search Console and AMP optimization adds a related workflow.
Use Search Console as the long-term check. Use PageSpeed Insights or Lighthouse for page-level diagnosis. Use a develo keeps showing the same issue after release.
How to Choose the Right Website Speed Optimization SEO Option
The right website speed optimization SEO option depends on who will act on the findings. A free tool is enough for a quick check. A developer tool fits a team that controls the code. A managed service fits a business that needs diagnosis, prioritization, and follow-through.
- Choose SearchX when speed work needs to connect with technical SEO, content plans, local visibility, or revenue pages.
- Choose PageSpeed Insights when you need a fast check on a specific URL.
- Choose Lighthouse when developers need repeatable lab audits during a build.
- Choose CrUX when you need anonymized field data from real Chrome users.
- Choose web-vitals when your team needs custom data in an internal analytics system.
- Choose DevTools when you need to inspect the browser and trace the cause of a problem.
- Choose Search Console when you need ongoing monitoring across URL groups.
Also ask who owns the fix. The tools in this shortlist mainly measure performance. None provides built-in optimization or CDN integration. That gap is why a service such as SearchX can be useful when your team needs the work managed, not just measured.
FAQ: Website Speed Optimization SEO
What is website speed optimization SEO?
Website speed optimization SEO is the work of improving page performance while protecting search visibility and user paths. It can include fixing slow templates, reducing heavy assets, improving interaction response, and tracking Core Web Vitals. Tools find issues, but a developer or SEO service must usually make the changes.
Which tool is best for checking Core Web Vitals?
PageSpeed Insights is a strong first choice for checking Core Web Vitals on a specific URL. Search Console is better for watching groups of pages over time. Lighthouse and DevTools help developers find causes. The best option depends on whether you need a quick score, trend data, or code-level detail.
Can Core Web Vitals tools fix a slow website?
Core Web Vitals tools usually report performance problems rather than fix them. They may point to a large image, a long task, or layout movement, but they don’t change your site automatically. A developer, technical SEO team, or managed provider must handle the repair and confirm the result.
Is PageSpeed Insights enough for SEO?
PageSpeed Insights is useful, but it isn’t enough for full SEO work. It checks page performance and can expose key user experience issues. SEO also depends on technical access, content quality, search intent, links, and site structure. Use the report as one input in a wider plan.
When should I hire a website speed optimization SEO agency?
Hire a website speed optimization SEO agency when your team can see the problems but can’t prioritize or fix them consistently. This is common on e-commerce sites, multi-location websites, and businesses with shared templates. SearchX can connect speed work with technical SEO and the pages that support your growth goals.
Conclusion
Use PageSpeed Insights for a quick check, DevTools for technical diagnosis, and Search Console for long-term monitoring. If speed issues affect key pages and your team needs fixes managed alongside SEO, start with SearchX. Ask for a focused review of your highest-value templates, then use the findings to move the work forward.