Want to know if your email campaigns are profitable? ROI (Return on Investment) is the ultimate metric to measure success. Here’s the quick formula:
ROI = ((Revenue – Cost) / Cost) × 100.
For example, if your campaign generates $12,000 in revenue and costs $2,000, your ROI is 500%, meaning every $1 spent brings back $6.
Why Does ROI Matter?
- It shows if your email campaigns are making money.
- Personalized emails often boost results but come with higher costs. ROI helps decide if the investment is worth it.
Key Steps to Measure ROI:
- Set Clear Goals: Define objectives like increasing monthly email revenue by 15%.
- Track Metrics: Monitor revenue per email (RPE), average order value (AOV), and customer lifetime value (CLV).
- Calculate Costs: Include all expenses – tools, labor, and design.
- Apply the Formula: Use the ROI formula to assess profitability.
- Compare Campaigns: Identify which types (e.g., abandoned cart emails) perform best.
Quick Example:
A personalized campaign costing $5,000 generates $25,000 in revenue. ROI = 400%. Compare this to a non-personalized campaign with a 275% ROI, and it’s clear where to invest.
Bottom Line: ROI isn’t just a number – it’s your guide to smarter email marketing. Keep reading to learn how to track, calculate, and improve ROI for your campaigns.
Measure True Email ROI With These Analytics
Setting Objectives and KPIs for ROI Measurement
Start by setting clear objectives – like increasing monthly email revenue by 15% in Q2 – and align your KPIs with these goals. Well-defined targets and relevant KPIs are the foundation for tracking progress and calculating ROI effectively.
E-commerce brands typically focus on four main goals: direct revenue generation, customer retention, list growth and activation, and profitability improvement. Each goal calls for specific KPIs. For revenue, monitor metrics like Revenue per Email (RPE), conversion rate from email traffic, and Average Order Value (AOV) from email sessions. If retention is your focus, track repeat purchase rates from email-driven customers, time between purchases, and churn rate differences between subscribers and non-subscribers. For list growth, measure new subscribers per campaign, reactivation rates of inactive users, and first-purchase rates from new subscribers. Profitability-related KPIs might include email-attributed gross profit, ROI per campaign, and customer acquisition cost (CAC) via email campaigns.
Set measurable goals for each objective. For instance, aim to "reduce churn rate among email subscribers by 10% within six months." This ensures your KPIs are actionable and meaningful for ROI analysis.
Financial KPIs to Track
These metrics focus on the profitability of your email campaigns.
Revenue per Email (RPE) is one of the most critical financial metrics. You calculate it by dividing email-attributed revenue by the total emails sent. For example, if a personalized campaign generates $7,500 from 50,000 emails, your RPE is $0.15. This metric provides a clear picture of the monetary value of each email sent.
Average Order Value (AOV) from email helps you understand customer purchase behavior. It’s calculated by dividing email-attributed revenue by the number of email-attributed orders. For instance, $7,500 in revenue from 300 orders results in an AOV of $25.00. AOV often varies by campaign type – abandoned cart emails, for instance, tend to generate higher values than general promotions.
Customer Lifetime Value (CLV) for email-acquired customers highlights long-term profitability. The calculation is straightforward: AOV × average purchase frequency per year × average customer lifespan in years. If email customers spend $60 per order, buy three times a year, and remain active for three years, their CLV is $540. This metric can justify higher initial investments in personalization when it leads to more valuable customers.
Campaign ROI ties everything together. The formula is: (Total revenue – Total cost) / Total cost. For example, a campaign that generates $7,500 in revenue with $1,500 in costs delivers an ROI of 4.0, or 400%. This means every dollar spent returns five dollars overall.
To track these metrics accurately, use UTM parameters in email links and set up e-commerce tracking in tools like GA4. This ensures order amounts, taxes, and refunds are captured correctly in U.S. dollars. Break down revenue by campaign type, automation flow (e.g., abandoned cart), personalization approach, and device type. On the cost side, include expenses like ESP subscription fees, overage charges, design and copywriting labor, data or personalization tools, and agency fees.
Engagement KPIs to Monitor
Engagement metrics act as early indicators of financial performance. While strong engagement often leads to better ROI, it’s not guaranteed – so both types of metrics should be tracked.
Open rate measures the percentage of delivered emails that are opened. It’s calculated by dividing opens by delivered emails and multiplying by 100. Average open rates exceed 24% across industries, but this can vary significantly. Personalized subject lines and relevant content often improve open rates. A low open rate may point to issues with your subject line, sender name, or send timing.
Click-through rate (CTR) measures the percentage of delivered emails that receive clicks, while click-to-open rate (CTOR) focuses on the effectiveness of your email content once it’s opened. The average CTR for B2B emails is 3.18%, but e-commerce campaigns with dynamic product recommendations can achieve much higher rates. CTOR is particularly useful for assessing how well your email content, layout, and calls-to-action align with the subject line. For instance, a strong open rate but weak CTOR suggests your email content isn’t delivering on the promise of the subject line.
Unsubscribe rate is a key indicator of list health and content relevance. Calculate it by dividing unsubscribes by delivered emails and multiplying by 100. Aim to keep this below 10%, though much lower is preferable. Rising unsubscribe rates often signal issues like overly frequent sends, irrelevant content, or poor personalization. High unsubscribe rates can also harm deliverability, which negatively impacts all other metrics.
Monitor these metrics weekly by segment and campaign. For example, if you see high opens but low CTR or CTOR, your subject lines may be effective, but your content or offers might not resonate. Conversely, strong CTR and CTOR but low conversions or AOV could indicate issues with landing pages, pricing, or checkout processes. A rising unsubscribe rate or spam complaints can hurt deliverability, ultimately reducing RPE and ROI across your email program.
Analyzing KPIs by Personalization Type
Not all personalization strategies yield the same results. To determine which approaches deliver the best ROI, categorize campaigns by their primary personalization type: subject line personalization (e.g., name, location, product name), dynamic product or content recommendations (based on browsing or purchase behavior), or triggered flows (e.g., abandoned cart, post-purchase, winback).
For each category, calculate metrics like average open rate, CTR, CTOR, unsubscribe rate, RPE, AOV, conversion rate, and ROI per send. This analysis helps identify which tactics are worth the investment. For example, testing personalized email widgets has increased CTR by up to 35% and significantly improved conversion rates. Triggered campaigns, such as abandoned cart emails, often outperform batch promotions in both CTR and revenue per send.
Run both personalized and non-personalized campaigns for four to eight weeks, grouped by type (e.g., promotional, triggered, lifecycle), and compare metrics. If generic campaigns average a 2% CTR and 0.3% unsubscribe rate, while dynamic personalized recommendations raise CTR to 4% with unsubscribes holding steady at 0.3–0.4%, this indicates stronger engagement without harming list quality. Over time, rely on your own rolling 90-day averages as benchmarks rather than generic industry stats.
For newer programs, focus on open rate, CTR, and basic RPE to confirm that personalization is working directionally. As your program matures, shift attention to metrics like RPE, AOV, email-attributed CLV, and campaign ROI by segment and personalization type. This progression allows you to move from proving personalization’s effectiveness to fine-tuning the strategies that deliver the best returns.
With objectives set and KPIs segmented, the next step is to implement detailed tracking and attribution methods.
Setting Up Tracking and Attribution
To ensure precise tracking of traffic and revenue in GA4, make it a habit to use UTM parameters on every email link. Stick to a consistent structure, such as setting utm_source=email, utm_medium=email, and using utm_campaign to label specific campaigns (e.g., black_friday_2025 or welcome_series). You can also include a parameter like utm_content to track personalization variants, such as dynamic_reco for product recommendations or cart_abandon for triggered flows. This setup allows you to filter GA4 reports by session source and analyze traffic, conversions, and revenue tied to your email campaigns.
Make sure to enable GA4 e-commerce tracking to capture key actions like product views, add-to-cart events, and revenue from UTM-tagged sessions. To see campaign performance, go to Reports → Acquisition → Traffic Acquisition in GA4, then filter by session source/medium containing "email." Many email service providers (ESPs) also integrate seamlessly with platforms like Shopify and WooCommerce, syncing order IDs, purchased products, and revenue back to the ESP. This integration gives you a full picture of revenue – broken down by campaign, segment, and automation flow – across both GA4 and your ESP.
How to Track Revenue from Email Campaigns
Every email link should include UTM parameters. For example:
https://www.yourstore.com/product-x?utm_source=email&utm_medium=promo&utm_campaign=summer_sale_2025&utm_content=segment_vip_personalized
The utm_content parameter is especially useful for distinguishing between personalization strategies, such as segment_cart_abandon, dynamic_reco, or first_name_subject. This allows you to compare the ROI of different approaches later.
Enable your ESP’s app or plug-in on your e-commerce platform to automatically sync order data, including timestamps, order values (in USD), and applied coupons. To ensure accurate tracking, map customer identifiers like email addresses or IDs between systems, linking purchases to subscriber segments. If native integrations fall short, consider using server-side tracking or webhooks to retain campaign IDs or UTM data, even for purchases made after the initial email click. Regularly compare revenue totals across ESP reports, GA4, and your e-commerce platform to catch any discrepancies.
Attribution Models for Email ROI
Attribution models help determine how credit for conversions is assigned across touchpoints. Here’s a breakdown of common models:
- Last-click attribution: Assigns 100% of the credit to the final interaction before a purchase. This method is simple and aligns with many GA4 default reports, but it might undervalue earlier emails in a sequence.
- First-click attribution: Gives full credit to the first interaction, highlighting which emails spark initial interest or re-engage subscribers. However, it doesn’t account for the influence of closing emails.
- Position-based (U-shaped) attribution: Allocates 40% of the credit to the first touch, 40% to the last touch, and distributes the remaining 20% across middle touches. This model better reflects multi-email sequences by recognizing both the acquisition and closing roles.
Here’s a quick comparison:
| Attribution Model | How It Works | Pros for Email ROI | Cons / Limitations |
|---|---|---|---|
| Last-click | 100% of credit goes to the last interaction before purchase. | Highlights emails that directly close sales. | May not account for earlier nurturing emails. |
| First-click | 100% of credit goes to the first recorded interaction. | Identifies emails that drive initial interest. | Ignores the impact of subsequent touchpoints. |
| Position-based (U-shaped) | 40% credit to first and last touch; 20% split across middle touches. | Recognizes both acquisition and closing roles. | Requires more complex data and analysis. |
GA4 defaults to data-driven attribution in many reports, spreading credit across touchpoints based on observed patterns. To see how different attribution models affect your campaign results, use the Attribution Model Comparison tool in GA4 (Advertising → Attribution → Model Comparison). By filtering for session source/medium containing "email", you can dig into revenue, conversions, and assisted conversions, offering a clearer picture of how email contributes to your overall performance.
Ensuring Accurate Tracking
To maintain accurate data, standardize your UTM parameters – avoiding variations like "email", "e‑mail", and "newsletter." Test links across major email clients and mobile devices before launching campaigns. If your checkout or payment provider uses a separate domain, enable cross-domain tracking in GA4 to prevent email clicks from being misclassified as "direct" traffic. Also, ensure that email-safe link wrappers or redirects don’t strip or overwrite UTM parameters.
Keep in mind that Apple Mail Privacy Protection (MPP) can inflate open rates, so it’s better to focus on clicks, on-site behavior, and conversions when evaluating email performance. Regular quality assurance checks – such as testing a purchase journey from an email and comparing the data in GA4 and ESP logs – can help confirm that session sources and revenue are being tracked correctly.
For businesses needing expert help, SearchX (https://searchxpro.com) offers services to audit GA4 setups, create tailored UTM and attribution strategies, and build dashboards that clearly show ROI by campaign, segment, and personalization approach.
How to Calculate ROI: Step-by-Step
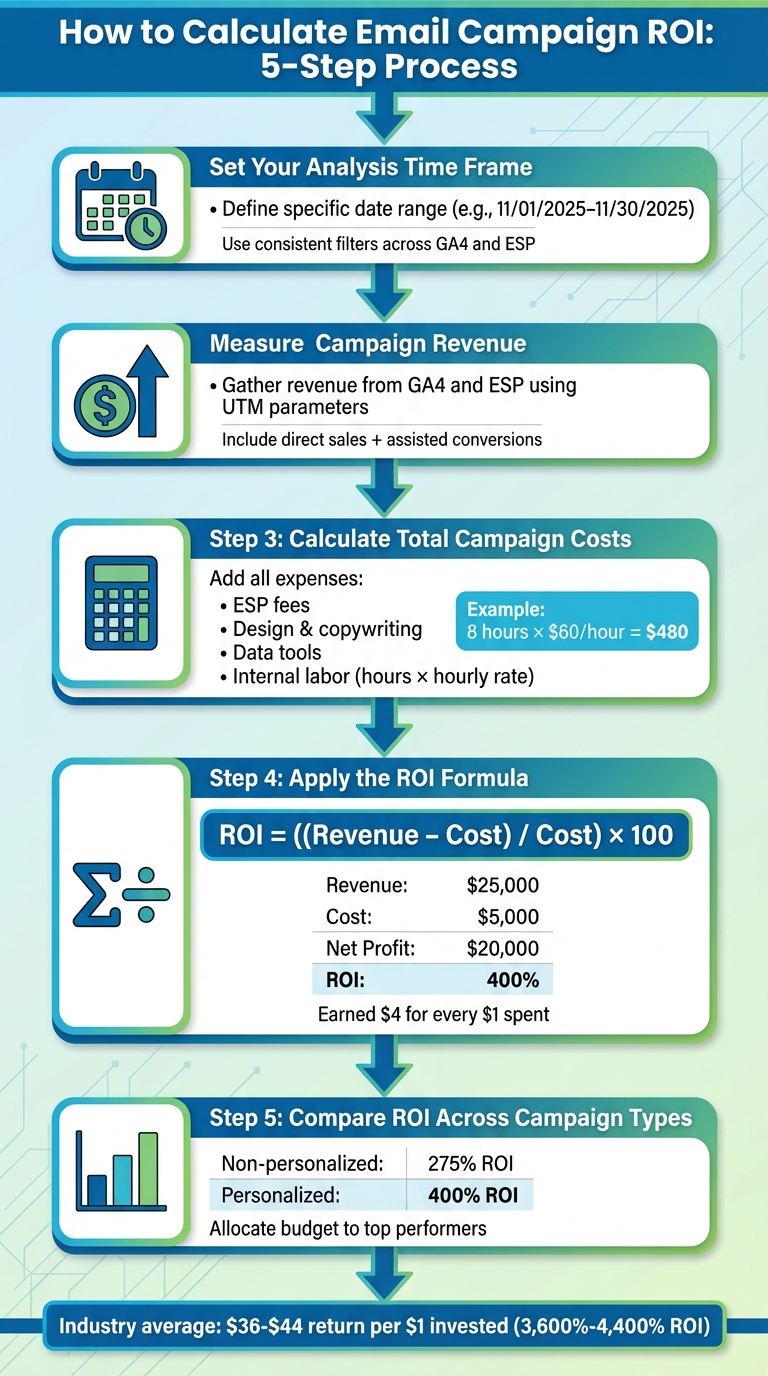
5-Step Process to Calculate Email Campaign ROI
To calculate ROI, use this formula:
ROI = ((Revenue – Cost) / Cost) × 100
This formula reveals how much profit you earn for every dollar spent. For example, email marketing often delivers $36–$44 in revenue for every $1 invested, which translates to an ROI of around 3,600%–4,400%.
Step 1: Set Your Analysis Time Frame
Start by defining a specific time frame for your analysis, such as 11/01/2025–11/30/2025. Stick to this date range across all tools, using U.S. date formatting (MM/DD/YYYY). Whether you’re reviewing a single campaign, like a Black Friday email, or an entire month of emails, ensure your filters are consistent across platforms like GA4 and your ESP. For automated flows, such as cart abandonment or welcome sequences, you might choose a window like "the first 30 days after sign-up." This ensures you’re comparing apples to apples and avoids blending sales from different periods, which could skew results.
Step 2: Measure Campaign Revenue
Gather revenue data from platforms like GA4 and your ESP, using pre-set UTM parameters to track performance. Include both direct e-commerce sales from the email and any assisted conversions identified in GA4’s attribution reports. If long-term revenue metrics, such as customer lifetime value (CLV), are relevant, include those figures too – but clearly label them so stakeholders know what’s factored in.
Step 3: Calculate Total Campaign Costs
Add up all campaign costs. This includes direct expenses like ESP fees, design, copywriting, data tools, and any extra charges for personalization features. Don’t forget indirect costs, such as internal labor. For example, if a team member spends eight hours on a campaign at $60/hour, that’s $480 in labor costs. Track time spent on tasks like strategy, segmentation, template creation, QA, and reporting, and multiply those hours by your team’s fully loaded hourly rate. Also, factor in any tools used for A/B testing, analytics, or integrations with GA4 or your CRM. Many marketers overlook acquisition or compliance costs, which can lead to underestimating ROI – be thorough to avoid this.
Step 4: Apply the ROI Formula
Once you have your revenue and cost figures, plug them into the formula. Here’s an example:
A personalized product-recommendation campaign generated $25,000 in revenue and cost $5,000 (including ESP fees, design, tools, and labor). Subtracting the cost from the revenue gives a net profit of $20,000. Divide $20,000 by $5,000 to get 4, then multiply by 100 to calculate an ROI of 400%. This means the campaign earned $4 for every $1 spent.
Smaller campaigns work the same way – for instance, a campaign with $2,500 in revenue and $500 in costs also results in a 400% ROI. This consistency makes it easy to compare performance across campaigns in your monthly reports.
Step 5: Compare ROI Across Campaign Types
Break down ROI by campaign type to see what’s working best. For example, compare personalized campaigns against non-personalized blasts, or evaluate flows like cart abandonment versus promotional emails. Here’s a quick example:
| Campaign Type | Revenue (USD) | Cost (USD) | ROI (%) |
|---|---|---|---|
| Non-personalized Blast | $15,000 | $4,000 | 275% |
| Personalized Campaign | $25,000 | $5,000 | 400% |
This comparison shows that personalized campaigns often yield higher returns, making a strong case for investing in personalization. Rank your campaigns by ROI and direct more budget toward the top performers. For instance, flows like cart abandonment or behavior-based recommendations often deliver better results.
Over time, these insights can help you refine your strategy. You might decide to test new approaches or even bring in experts like SearchX (https://searchxpro.com) to enhance segmentation, data integration, or content optimization for better performance. Use these ROI findings to fine-tune your campaigns and allocate resources where they’ll have the greatest impact.
Using ROI Data to Improve Campaign Performance
Once you’ve crunched the numbers and calculated your ROI, the next step is where the magic happens: using those insights to fine-tune your campaigns. ROI data reveals what’s working, what’s falling short, and where you can make adjustments to get better results. By linking engagement metrics to revenue, experimenting with personalization strategies, and identifying underperforming campaigns, you can turn data into actionable steps to maximize returns. This process naturally feeds into refining your email strategies.
How Engagement Metrics Affect ROI
Engagement metrics like open rate, click-through rate (CTR), and click-to-open rate (CTOR) provide early indicators of how well your campaigns are performing. These metrics, when tied to revenue data, help you understand how engagement translates into visits, conversions, and ultimately, ROI.
To make this connection clear, calculate revenue per open and revenue per click for your campaigns. For instance, if an apparel retailer increases their open rate from 18% to 25% on a 100,000-email campaign, that’s 7,000 additional opens. With revenue per open at $0.30, this translates to an extra $2,100 in revenue without increasing costs. Similarly, if a beauty retailer doubles their CTR from 2% to 4% on a 50,000-subscriber list while maintaining $3.00 revenue per click, they’ll generate an additional $3,000 in revenue.
Personalization plays a key role here. Tailoring email content to a user’s browsing or purchase history makes messages more relevant, which often leads to higher CTR and conversion rates. For example, dynamic product recommendations can increase click-through rates by about 35%, and in some cases, personalized widgets have boosted CTR by 289% and conversion rates by 189%. A U.S. electronics store that implements browse-abandonment emails – showing recently viewed items and related accessories – could see 50 extra orders per month. With an average order value of $120, that’s an additional $6,000 in monthly revenue, significantly improving ROI when weighed against the cost of automation.
A/B Testing to Increase ROI
A/B testing is a structured way to improve engagement and ROI systematically. Focus on high-impact, low-cost elements like personalized subject lines, dynamic product recommendations, CTA copy and placement, and optimal send times or days. Small changes, such as tweaking subject lines, can quickly yield noticeable improvements in open rates and revenue per email.
Here’s an example of how to test personalized subject lines. Choose one variable – such as adding the recipient’s first name or referencing a recently viewed product – and split your audience into two groups: Version A (generic subject) and Version B (personalized subject). Run the test under identical conditions and measure changes in open rate, CTR, conversion rate, and revenue per email.
For instance, if the personalized subject line increases the open rate from 20% to 24% and raises revenue per email from $0.80 to $0.96 on a 100,000-send campaign, that’s an extra $16,000 in revenue. With costs unchanged, this significantly boosts ROI and provides a clear case for rolling out the winning variant to your entire list. When analyzing results, don’t just look at higher opens or clicks. Track conversion rate, average order value (AOV), revenue per recipient, and overall campaign ROI. Sometimes, a variant with fewer opens but higher conversions and AOV can deliver better ROI. By storing results from multiple tests, you can build a benchmark library to guide future decisions and budget allocation.
Once you’ve identified the winning elements, apply those insights to improve underperforming campaigns.
Fixing Low ROI Campaigns
When a campaign underperforms, common culprits include low engagement, deliverability issues, and poor personalization. Weak subject lines, irrelevant offers, or confusing CTAs often lead to low engagement. Deliverability problems – like emails landing in spam folders – can stem from poor list hygiene or sending practices. Bad personalization, such as recommending irrelevant products or using outdated data, can also hurt performance.
To tackle these issues, start with the basics: check list health (bounce rates, spam complaints, inactive subscribers), inbox placement, and engagement trends by segment. For instance, are cart-abandonment emails showing out-of-stock items or irrelevant upsells? Also, assess whether incentives align with your goals. Discounts that fail to drive profitable revenue or offers that encourage unprofitable redemptions can distort ROI, even if engagement metrics look fine.
In the short term, clean up your list by removing unengaged or invalid contacts, improve subject lines to better communicate value, and fix personalization errors like mismatched product recommendations. Over the medium term, refine segmentation, adjust behavioral triggers, and ensure incentives contribute to positive margins and ROI.
For a longer-term fix, invest in better data integration across your ESP, CRM, and analytics tools. This enables accurate revenue attribution, identification of high-value segments, and continuous improvement of your personalization and budgeting strategies. Regularly compare ROI across different campaign types – such as weekly promotions, cart-abandonment emails, and post-purchase cross-sell sequences – to identify high-performing campaigns that deserve more budget or broader reach. Campaigns with consistently low ROI should be paused, redesigned with better personalization, or targeted to smaller, more relevant segments to reduce waste and protect your sender reputation.
Conclusion
Key Takeaways
Measuring ROI effectively depends on setting clear KPIs, tracking accurately, and accounting for all costs. Start by defining financial and engagement KPIs, implementing reliable tracking tools like UTM parameters and attribution models, and ensuring you capture every dollar of revenue and expense. Use the ROI formula to analyze performance and refine your campaigns. Engagement metrics can act as early indicators, and when tied to revenue, they pinpoint areas for improvement – whether it’s tweaking subject lines, enhancing personalization, or optimizing landing pages.
The rewards are undeniable. Personalization significantly boosts results – AI-driven personalization, for instance, can increase revenue by up to 41% and improve click-through rates by over 13% compared to basic segmentation. Accurate measurement is the key to unlocking these benefits. Track metrics like revenue per recipient, average order value, and customer lifetime value alongside engagement KPIs. Compare ROI across different campaign types to identify which flows – such as cart abandonment, browse recovery, or post-purchase cross-sell – deserve more resources and which might need adjustments.
This data-driven approach helps align your marketing budget with the campaigns delivering the best results.
Using ROI Data for Budget Planning
ROI data is a powerful tool for smarter budget allocation. By ranking campaigns and automated flows based on profit and ROI, you can reallocate your budget to maximize returns and set realistic revenue goals backed by performance data. For instance, if a personalized cart-abandonment sequence achieves a 900% ROI while another campaign lags at 200%, it makes sense to invest more in the high-performing flow and either refine or scale back the weaker one. Segment-level ROI insights can also guide decisions about where to enhance personalization, improve creative elements, or adjust messaging frequency, ensuring your resources are allocated where they’ll have the most impact.
Understanding metrics like revenue per subscriber and revenue per send over time also helps estimate the value of new, qualified subscribers. This knowledge can optimize your customer acquisition budget across channels like paid search or social media, ensuring your investments in list growth are well-placed. Regular ROI reviews – whether done quarterly or monthly – keep your spending aligned with what’s currently working, rather than relying on outdated assumptions.
Scaling Your Email Program with ROI Insights
Once your budget planning is set, shift focus to scaling strategies that drive long-term growth. High-ROI personalized campaigns not only deliver strong returns but also provide a framework for sustainable expansion. Long-term ROI tracking can inform your broader digital strategy. For example, tracking ROI by acquisition source might reveal that subscribers from organic search deliver higher lifetime value, justifying greater investment in SEO and content marketing. Agencies like SearchX, which specialize in ecommerce-specific SEO strategies, can help attract high-quality search traffic that aligns with your best-performing email segments. This creates a seamless customer journey from search to purchase, amplifying the impact of your email campaigns.
As you scale, use ROI data to identify the best-performing triggers, offers, and content themes, then replicate those successes across new audience segments or product lines. Regularly reviewing ROI ensures your scaling efforts are grounded in performance data. Track metrics like customer lifetime value, repeat purchase rates, and list health alongside campaign ROI to ensure growth efforts enhance the overall quality of your customer base, not just short-term revenue. This cycle of measuring, testing, refining, and scaling turns personalized email into a reliable engine for sustained growth.
FAQs
How can I measure the ROI of my personalized email campaigns effectively?
To understand how effective your personalized email campaigns are, focus on a few key performance metrics. Start with open rates and click-through rates (CTR) to measure how well your emails engage recipients. From there, track conversion rates to see how many people followed through on your desired action – whether that’s making a purchase, signing up for a service, or something else.
Once you have these numbers, calculating ROI is straightforward. Compare the revenue your campaign brought in against its total cost. For instance, if your campaign generated $5,000 in sales and cost $1,000 to execute, your ROI would be 400% – calculated as (($5,000 – $1,000) / $1,000).
For a deeper understanding, break your audience into segments and analyze how each group performs. This can reveal patterns and help you fine-tune your approach for even stronger results in the future.
What key metrics should I track to measure the success of my email campaigns?
To gauge the performance of your email campaigns, keep an eye on three key metrics: open rates, click-through rates (CTR), and conversions. These indicators reveal how well your emails capture attention, encourage engagement, and achieve your goals.
- Open rates tell you how many recipients opened your email. This metric is a good indicator of how compelling your subject line and timing were.
- Click-through rates measure the percentage of recipients who clicked on links in your email. High CTRs suggest your content resonates with readers and encourages them to take action.
- Conversions track how many recipients completed a desired action, like making a purchase or signing up. This is a direct measure of how well your emails contribute to your overall goals.
By analyzing these metrics, you can fine-tune your approach and get the most out of your personalized email campaigns.
How do attribution models impact the ROI measurement of personalized email campaigns?
Attribution models are essential for assessing the impact of your personalized email campaigns. They help assign credit to various touchpoints along the customer journey, giving you insights into which interactions played a key role in driving conversions.
For instance, a last-click attribution model assigns all the credit to the final interaction before a customer makes a purchase. In contrast, a first-click model focuses on the very first touchpoint that initiated the journey. Then there are multi-touch models, which spread the credit across several interactions, offering a broader view of the customer’s path. Selecting the right model is crucial for accurately measuring your campaign’s ROI and making informed decisions to refine your strategies moving forward.