Looking for the best heatmap tool to understand your website users? This guide compares 9 leading heatmap tools – Hotjar, Crazy Egg, Microsoft Clarity, Mouseflow, Glassbox, Inspectlet, FullStory, VWO Insights, and Lucky Orange – based on their features, pricing, and use cases. Here’s what you need to know:
Key Takeaways:
- Free Options: Microsoft Clarity offers unlimited heatmaps and session recordings at no cost.
- Affordable Tools: Crazy Egg ($29/month) and Lucky Orange ($39/month) are great for small businesses.
- Advanced Insights: FullStory and Glassbox provide AI-driven analytics for enterprises (custom pricing).
- Versatile Features: Hotjar and Mouseflow balance usability and robust features starting at $31–$39/month.
- Enterprise Solutions: VWO Insights and Glassbox cater to high-traffic websites with advanced analytics.
Quick Comparison Table
| Tool | Free Plan | Starting Price | Heatmap Types | Session Replay | Best For |
|---|---|---|---|---|---|
| Microsoft Clarity | Yes (unlimited) | Free | Click, Scroll | Yes (unlimited) | Beginners, budget users |
| Hotjar | 35 daily recordings | $39/month | Click, Scroll, Rage | Yes | Small to medium businesses |
| Crazy Egg | 30-day trial | $29/month | Click, Scroll, Confetti | Limited | Simple funnel analysis |
| Mouseflow | Yes | $31/month | 6 types | Yes | Comprehensive insights |
| Lucky Orange | Yes | $39/month | Real-time | Yes (live view) | Growing businesses |
| FullStory | 10K sessions | Custom Pricing | Standard | AI-powered | Large teams, enterprises |
| VWO Insights | Limited free | $199/month | Dynamic, Click | Yes | High-traffic enterprises |
| Glassbox | No | Custom Pricing | Interaction Maps | Yes | Enterprise-level analytics |
| Inspectlet | Yes | $39/month | Eye-Tracking | Yes | Basic and budget-friendly |
Each tool serves different needs – from free beginner tools like Microsoft Clarity to enterprise-level platforms like VWO Insights and Glassbox. Choose based on your budget, traffic volume, and desired features.
+5 Best Heatmap & Session Replay Software Tools in 2025 (Full Demo & Comparison)
1. Hotjar
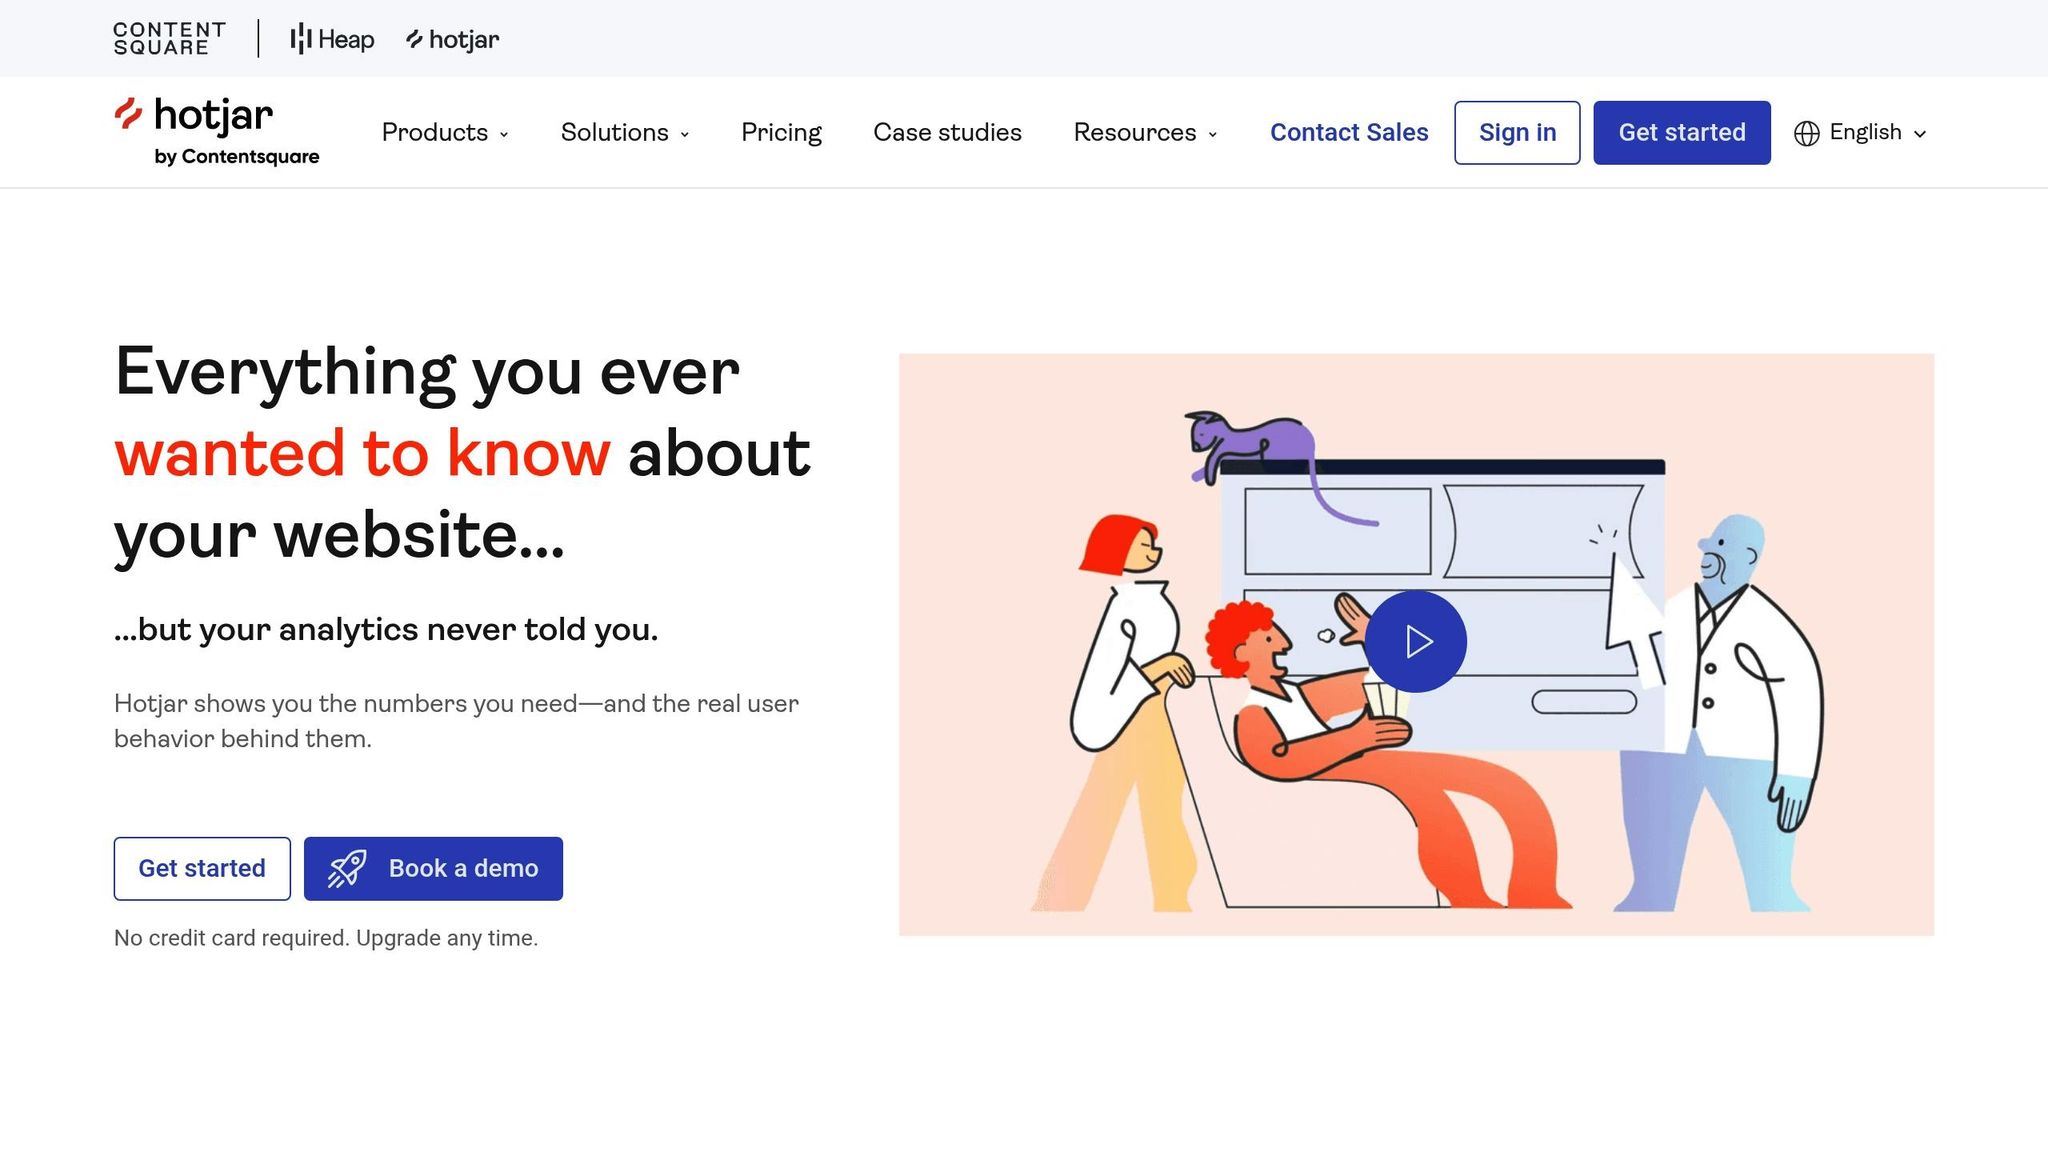
Hotjar is a popular heatmap tool, trusted by over 1.1 million websites across 180+ countries. It combines heatmaps, session recordings, and surveys to help businesses understand how visitors interact with their sites.
Heatmap Types
Hotjar offers five types of heatmaps, each offering a unique perspective on user behavior:
- Click Heatmaps: These show exactly where users click or tap on desktop and mobile, helping identify whether visitors are engaging with intended links or mistakenly clicking on non-clickable elements.
- Move Heatmaps: By tracking mouse movements, these maps reveal areas that grab user attention, even if no clicks occur.
- Scroll Heatmaps: These display how far down users scroll, helping determine if important content below the fold is being overlooked.
- Engagement Zone Maps: A comprehensive view that combines data from clicks, movements, and scrolls into one map.
- Rage-Click Heatmaps: These highlight areas where users repeatedly click in frustration, often pointing to broken links or confusing interface elements.
Hotjar stores heatmap data for up to 365 days, making it easier to analyze trends and make informed decisions.
The tool has delivered measurable results for businesses. For instance, Taskworld used click heatmaps to uncover a problem in their signup process and increased conversions by 40% with a simple fix. Similarly, Trampoline Plezier used scroll heatmaps to learn that users weren’t reaching the end of their content, leading to an 11% boost in conversions.
"Hotjar was our first choice for heat mapping because of what we had heard in the market and also because it offers great value for the price."
– Shiv Sharma, Head of Content, Taskworld
These insights go beyond heatmaps, feeding into session replays and integrations for deeper usability analysis.
Session Replay
In addition to heatmaps, Hotjar records user sessions. This feature adds context to heatmap data, making it easier to pinpoint and address usability issues.
Integration Options
Hotjar supports seamless integration with popular platforms like WordPress, Shopify, Google Tag Manager, Slack, Microsoft Teams, Jira, and Trello. It also connects with analytics tools such as Google Analytics and Mixpanel.
For example, Hussle, an online marketplace for gyms and spas, uses Hotjar’s Slack integration to send rage-click data to a channel they’ve humorously named the "folder of absolute pain." This allows their Customer Experience Manager to quickly respond to widespread issues.
"I have no idea how many hours we saved or how many users we’ve helped as a result, but we couldn’t spot these issues without Hotjar."
– Luke, Product Lead, Hussle
For businesses with unique needs, Hotjar also offers Zapier integration and API access for custom connections.
Pricing and Plans
Hotjar’s pricing is tiered to suit different business needs. Its modular structure spans three products: Observe (heatmaps and recordings), Ask (surveys and feedback), and Engage (user interviews).
Observe:
- Basic (Free) – unlimited heatmaps and recordings
- Plus – $39/month
- Business – $99/month
- Scale – $213/month
Ask:
- Free plan – up to 3-question surveys
- Plus – $48/month
- Business – $64/month
- Scale – $128/month
Engage:
- Free plan – limited access
- Plus – $39.20/month
- Business – $440/month
Annual payments come with discounts, and bundling multiple products offers additional savings. Hotjar has an overall rating of 4.7 stars and a value-for-money score of 4.6 out of 5.
Additionally, the platform complies with GDPR and CCPA, ensuring high standards of data privacy and protection – an essential feature for businesses operating under strict regulations.
2. Crazy Egg
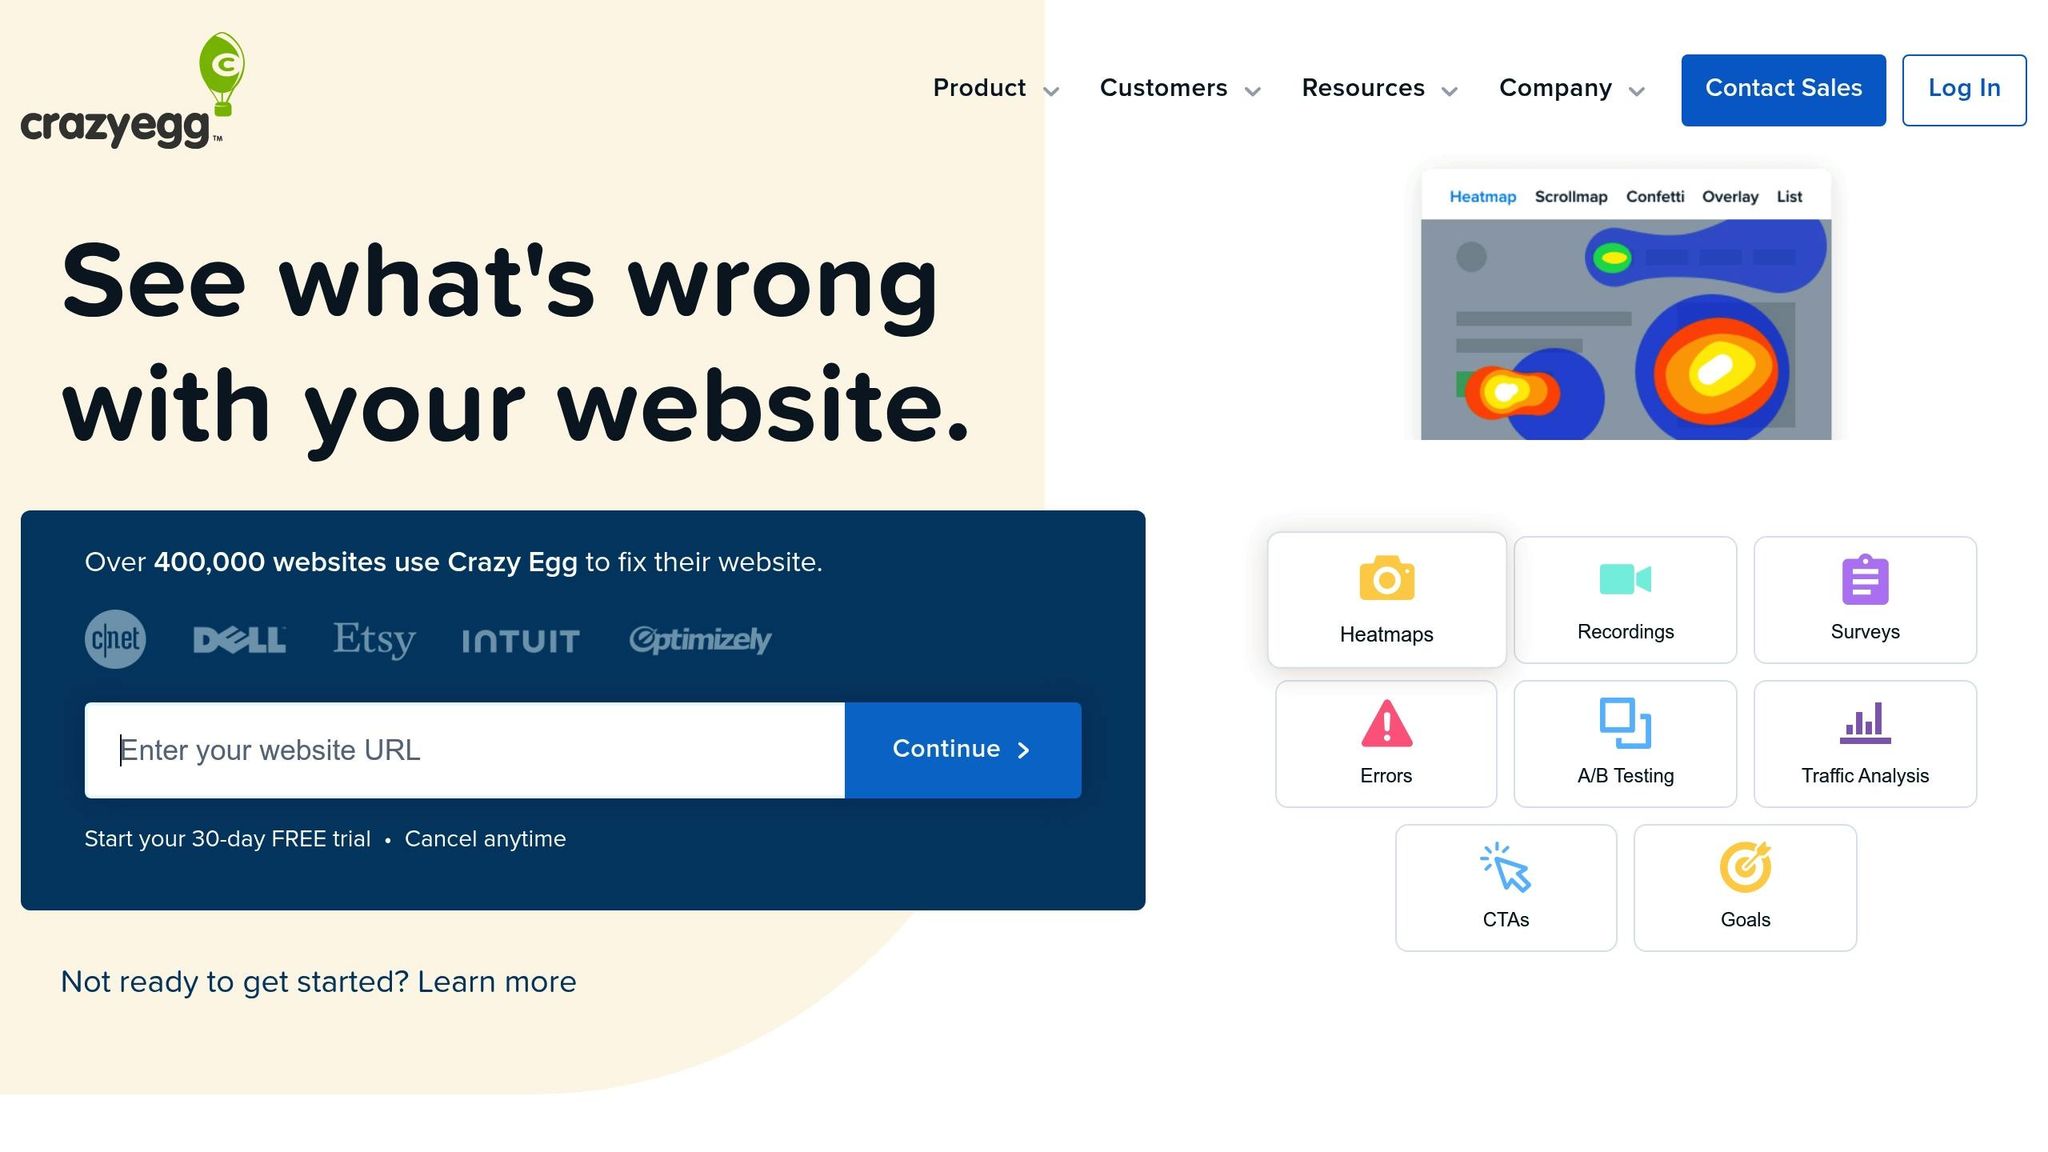
Crazy Egg has been helping websites improve for over ten years, serving more than 400,000 sites by turning raw data into easy-to-understand visuals that show how visitors interact with web pages. Here’s a closer look at the heatmap tools Crazy Egg provides to help you understand user behavior.
Heatmap Types
Crazy Egg offers five types of heatmaps, each designed to highlight different aspects of user interaction:
| Heatmap Type | Description | How It Helps Analyze User Behavior |
|---|---|---|
| Click Maps | Highlights the areas of a webpage that get the most clicks, using hotter colors to show higher activity. | Identifies the most engaging elements and areas on the page. |
| Scroll Maps | Tracks how far down visitors scroll, showing which content gets seen and which doesn’t. | Helps you place key content and CTAs in spots that get the most attention. |
| Confetti Maps | Displays individual clicks, color-coded by metrics like traffic source or operating system. | Provides detailed insights into user behavior based on specific attributes. |
| Overlay Maps | Breaks down click metrics for individual elements, showing their impact on user actions. | Makes it easier to see which buttons or CTAs are performing best. |
| List Maps | Offers a numerical breakdown of clicks on every element of the page. | Perfect for exporting and analyzing raw data. |
The results speak for themselves. Businesses using Crazy Egg have reported impressive improvements: placing CTAs based on Crazy Egg’s insights led to a 433% increase in conversions, a 21% boost in button clicks, and a 15.7% rise in sales. These examples show how actionable insights from Crazy Egg can lead to real-world gains.
Integration Options
Crazy Egg works smoothly with major platforms like WordPress, Shopify, and Joomla, making it easy to collect data without disrupting your current setup. For those using Google Tag Manager, Crazy Egg offers a quick and customizable setup with minimal coding.
Additionally, Crazy Egg integrates with Instapage, enabling users to analyze their landing pages, identify areas for improvement, and test changes effectively.
Pricing and Plans
Crazy Egg offers four main pricing plans, all billed annually:
- Starter – $29/month: Includes 5,000 tracked pageviews, 5 heatmap reports, 50 recordings/month, 6 months of recording storage, and unlimited surveys and domains.
- Plus – $99/month: Covers 150,000 tracked pageviews, 75 heatmap reports, 1,000 recordings/month, 2 years of recording storage, unlimited A/B testing, CTAs, conversion tracking, error tracking, and priority support.
- Pro – $249/month: Offers 500,000 tracked pageviews, 100 heatmap reports, 5,000 recordings/month, and all features included in the Plus plan.
- Enterprise – $499/month: Includes 1,000,000 tracked pageviews, 200 heatmap reports, 10,000 recordings/month, SAML Single Sign-On, and onboarding and training.
A free trial is available, and Crazy Egg holds a 4.0/5 rating for value for money. Up next, we’ll see how these features and pricing stack up against other top tools in the market.
3. Microsoft Clarity
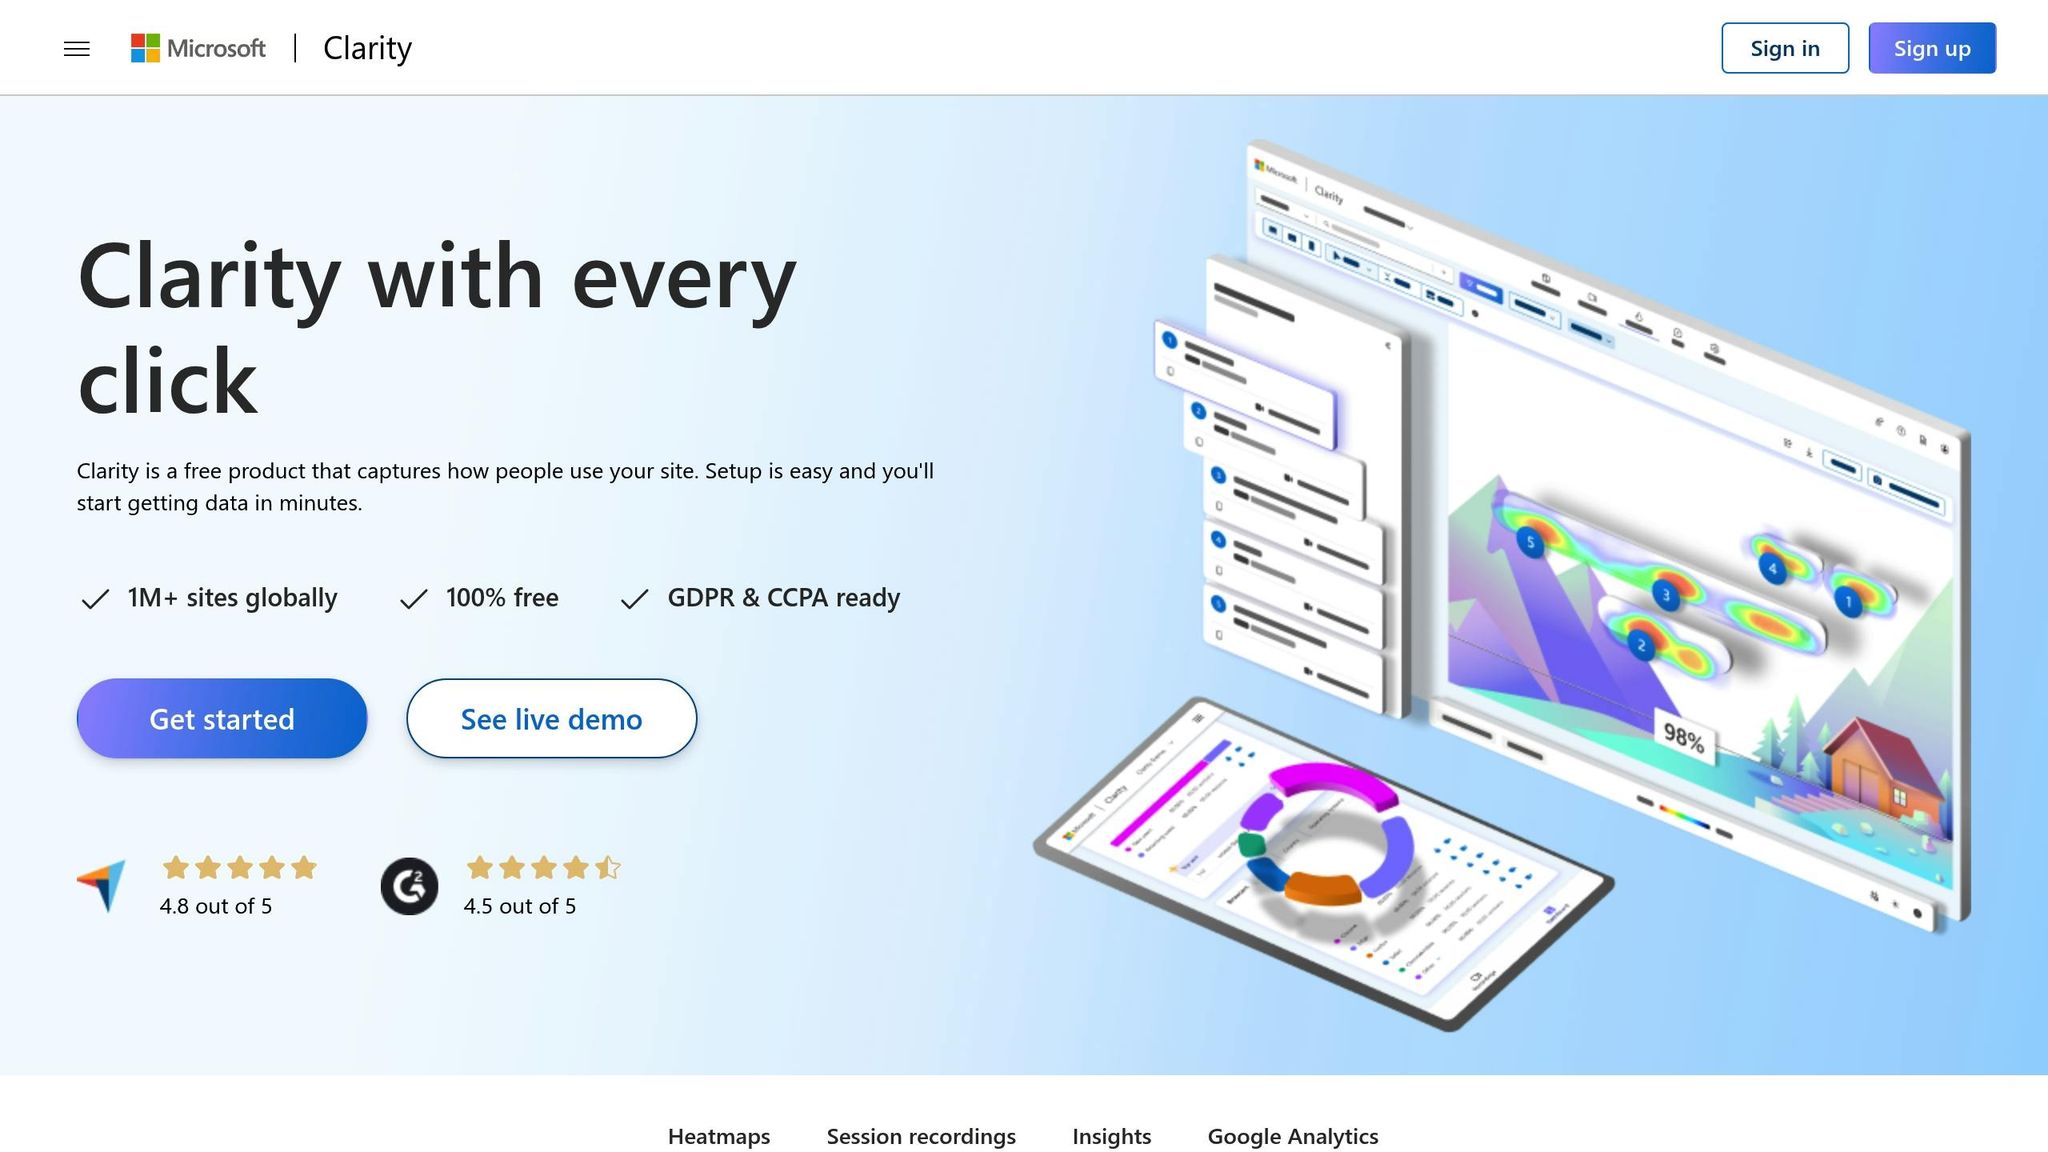
After diving into Hotjar and Crazy Egg, let’s turn our attention to Microsoft Clarity – a no-cost option that packs a punch with its robust features. Used by over a million websites globally, Microsoft Clarity offers a powerful way to analyze user behavior without spending a dime. It’s a great choice for businesses of all sizes looking to uncover insights about their audience.
Heatmap Types
Microsoft Clarity provides five types of heatmaps, which are generated instantly as users interact with your site. These heatmaps use a color-coded system, with red marking popular areas and blue highlighting less-used sections, giving you a quick visual of what’s working and what’s not.
| Heatmap Type | Description | User Behavior Insights |
|---|---|---|
| Click Maps | Tracks all user clicks, including dead clicks, rage clicks, error clicks, first clicks, and last clicks. | Helps identify the most engaging elements and optimize their placement for better conversions. |
| Scroll Maps | Monitors how far visitors scroll down a page, showing which sections hold their attention. | Pinpoints the most and least viewed areas, helping you position crucial content effectively. |
| Area Maps | Aggregates total clicks for all elements in a selected area. | Lets you analyze user behavior within a specific section of your page. |
| Conversion Maps | Tracks clicks that result in purchases or other desired actions. | Highlights which elements drive conversions and which may need improvement. |
| Attention Maps | Measures how much time users spend on different parts of the page. | Reveals sections that capture the most attention, helping you refine content placement. |
Clarity’s heatmaps automatically track user clicks and scrolls across devices, with data stored for up to 13 months. While there’s a cap of 100,000 page views per heatmap, this limit is sufficient for most websites, though high-traffic sites may need to assess their needs further.
These heatmaps work hand-in-hand with Clarity’s session replay feature, creating a more complete picture of user behavior.
Session Replay
Microsoft Clarity’s session replay tool provides animated recordings of user interactions, capturing every click, scroll, and movement. Each project can record up to 100,000 sessions daily, with recordings retained for 30 days. A selection of favorite and randomly sampled recordings is saved for up to 13 months.
What sets Clarity apart is its use of AI to summarize session data and identify trends, making it easier to spot recurring patterns. You can also filter recordings by JavaScript errors to quickly diagnose and resolve bugs. Plus, the platform allows you to label recordings for easy organization and reference.
Integration Options
Microsoft Clarity doesn’t stop at analytics – it also integrates seamlessly with other tools to streamline your workflow. It works with major platforms like Microsoft Ads, Google Analytics, and popular CMS systems such as WordPress, Shopify, and Wix. WordPress users, in particular, can benefit from plugins like WooCommerce, Clarity Plugin, and SEOPress to simplify the setup process.
Here’s what one user had to say about the ease of integration:
"Set this up in 20 seconds for our site and I’m seeing data I never had in less than 30 minutes… really easy integration."
For businesses running Microsoft Ads campaigns, Clarity’s Universal Event Tracking (UET) feature offers a code-free way to track conversions, making it a breeze to measure ad performance.
Pricing and Plans
Here’s the best part: Microsoft Clarity is completely free. There are no hidden fees, and it includes unlimited session recordings and 13 months of data retention.
As Scott Kivowitz, Chief Community Officer at Imagely, put it:
"For a user experience analytics tool, I don’t think you will find a better solution than what Microsoft has done with Clarity."
Robusta, an Android app development company, also shared their experience with Clarity. AbdelRahman el Naka, their Marketing Manager, explained:
"Clarity for Android has become our go-to tool for analyzing user behavior in our Android apps. It helps us understand how users interact with our app, and improve our engagement and conversion. Clarity has become essential for our workflow."
With its blend of advanced features, seamless integrations, and zero cost, Microsoft Clarity is a standout choice for businesses that want to dig into user behavior without worrying about budget limitations.
4. Mouseflow
Let’s dive into Mouseflow – a platform that goes beyond standard analytics by offering live heatmaps specifically designed for dynamic website elements. This feature sets it apart, as it captures user interactions with components like dropdown menus and pop-ups in real time.
Heatmap Types
Mouseflow provides six types of heatmaps, each shedding light on different aspects of user behavior:
- Click Heatmaps: These show exactly where users click, helping you assess the effectiveness of links and call-to-action buttons. They can also reveal unexpected patterns, like users clicking on non-clickable elements, which might indicate design issues.
- Scroll Heatmaps: By tracking how far users scroll, these maps help you identify where to place critical content. Research indicates that over half of users spend less than 15 seconds on a page, making this data indispensable.
- Attention Heatmaps: These measure how long users focus on specific sections of your page. Since mouse cursors often align with visual attention, this tool is helpful for refining content placement.
- Movement Heatmaps: By mapping mouse movements, these heatmaps reveal how users navigate your site and which elements grab their attention. They’re particularly useful for assessing usability and troubleshooting specific issues.
- Geographical Heatmaps: These show where your visitors are located, offering valuable insights for targeting regional marketing campaigns.
Mouseflow’s standout feature is its live heatmaps, which excel at capturing interactions with dynamic elements like dropdowns and pop-ups. Unlike static heatmaps, these provide an accurate view of user engagement with moving components, making them perfect for optimizing modern, interactive websites.
Session Replay
Mouseflow’s session replay tool takes user behavior analysis to the next level. It doesn’t just record sessions – it reconstructs them to provide a detailed view of user interactions. From clicks and scrolls to rage clicks and moments of hesitation, you get a complete picture of how visitors experience your site.
The platform also features a friction scoring system that automatically flags problematic user interactions. This means you can skip hours of recordings and go straight to the moments that matter most.
Privacy is a priority, with automatic anonymization of sensitive data and full control over what gets recorded. You can filter sessions by traffic source, location, device type, or specific behaviors, making it easy to focus on relevant insights.
For instance, Derek Rose saw a 37% boost in conversions by leveraging Mouseflow’s behavior analytics tools. As Mouseflow aptly states:
"Numbers tell you what. Replays show you why".
Integration Options
Mouseflow doesn’t operate in isolation – it connects seamlessly with a range of platforms to enhance your data insights. Key integrations include:
- Google Analytics and Adobe Analytics: Combine behavioral data with campaign performance insights.
- HubSpot: Track users by their platform ID for a more personalized approach.
- Shopify: Enable smooth eCommerce integration.
- Zendesk and Freshdesk: Allow support teams to view user behavior behind every ticket.
For A/B testing, Mouseflow works with tools like ABlyft, Unbounce, and Optimizely, helping you confidently identify winning variations. It also integrates with Microsoft Teams and Slack, enabling custom notifications about user behavior to keep your team informed.
Setting up Mouseflow is straightforward, with support for popular CMS platforms like WordPress, Drupal, Joomla, Magento, and WIX. These integrations make it easy to unlock deeper insights and streamline your workflow.
5. Glassbox
Glassbox takes user behavior analysis to another level with its interaction maps, offering detailed metrics and AI-driven insights that go far beyond traditional tools. By integrating advanced analytics, Glassbox provides a more precise understanding of the user experience.
Heatmap Types
Glassbox’s interaction maps aren’t your typical heatmaps. They provide detailed data like click rates, focus time, errors, struggles, and even revenue impact for every element on your site. Instead of just showing color-coded visuals, these maps include actual numbers and percentages, giving you a deeper layer of data to work with.
Here are some standout features:
- Zone Analysis: Break your page into specific zones to see how users engage with different areas.
- Scroll Tracking: Measure exactly how far users scroll to identify whether key content is being missed.
- Comparative Analysis: Compare behavior trends across time periods, audience segments, or different A/B test versions.
One of the most impressive aspects of Glassbox is its patented tagless capture technology. This system automatically analyzes all user interactions without relying on pixel-based coordinates, which makes it more accurate and adaptable than traditional heatmaps.
Session Replay
Glassbox also offers session replay, allowing you to watch video-like reconstructions of user journeys across websites and apps. Every interaction and technical event is captured automatically, giving you a complete view of each session.
The platform’s AI-powered Glassbox Insights Assistant (GIA) helps surface key customer behavior insights quickly, saving you from sifting through hours of data. Struggle indicators, like rage clicks, are flagged automatically, so you can pinpoint friction points without manually reviewing lengthy recordings.
The impact of these features is clear. For instance, SoFi, a financial services company, used Glassbox to fix a form issue, potentially saving $9 million in revenue. Similarly, Visa CAL, an Israeli credit card company, tripled its conversion rate by leveraging Glassbox’s behavior analytics.
"Real-time session replays reveal the user journey, showing how customers behave and why – giving you the insights to enhance your digital experiences." – Glassbox
These robust tools make Glassbox stand out in the market, especially as we dive into its pricing model.
Integration Options
Glassbox integrates seamlessly with external CRMs, analytics platforms, and marketing tools, enhancing your current workflow. It works with well-known platforms like Google Analytics and Adobe Analytics, allowing you to combine behavioral insights with performance data. Plus, with its tagless setup, you can start capturing detailed user data right away – no extensive technical configuration needed.
Pricing and Plans
Glassbox offers a custom pricing model based on your specific needs, including package features, session volume, and data retention period. While pricing isn’t publicly listed, potential customers can contact the sales team for a tailored quote. This approach is designed for enterprise clients and considers whether you’re tracking web or app sessions. However, there’s no free trial available.
Despite the lack of transparent pricing, user satisfaction is high. Glassbox holds an impressive 4.9/5 rating on Capterra from 54 reviews, with users praising its value for money, ease of use, and customer service.
"Glassbox data is much richer, at the end of the day we get better insights and make better decisions. The fact that nothing needs to be tagged – but all struggles and issues are visible – is a huge benefit for us." – Dror L., TechOps Manager
For companies looking to deeply analyze user behavior and optimize digital experiences with AI-driven insights, Glassbox appears to be a worthwhile investment. Its comprehensive suite of tools and advanced tracking capabilities set it apart in the field.
6. Inspectlet
Inspectlet takes a distinctive approach to understanding user behavior by offering eye-tracking insights through mouse movement analysis. With over 90,000 companies relying on the platform and research showing a strong correlation between mouse and eye movements, it provides eye-tracking-like data – without the need for costly hardware.
Heatmap Types
Inspectlet offers three types of heatmaps to help uncover user behavior:
- Eye-Tracking Heatmaps: These track mouse movements to highlight where users focus their attention on the page.
- Click Heatmaps: These reveal which elements – like buttons, links, images, or even non-clickable text – draw user clicks.
- Scroll Heatmaps: These show how far visitors scroll down the page, indicating which sections hold their attention.
Together, these heatmaps provide a comprehensive view of user focus, interaction, and scrolling habits. This visual data works hand-in-hand with Inspectlet’s session replay feature for deeper insights.
Session Replay
Inspectlet’s session recording tool captures every detail of a visitor’s interaction – mouse movements, clicks, scrolls, and even keypresses. By using advanced filtering and tagging, you can zero in on where users drop off in conversion funnels or other key sequences. Metadata tagging adds another layer of precision, making it easier to analyze sessions.
For instance, Guy Riese shared his experience:
"By using Inspectlet to screen suspect transactions for clear indicators of fraud, we’ve saved over $50,000 in potential losses by picking up on the scam and not shipping the items… Absolutely invaluable data we have access to. We’d truly be lost without Inspectlet."
Similarly, Sheryl Carr praised its problem-solving capabilities:
"@Inspectlet saves so much guesswork when customers write in with problems. Just watch the recording of what the user did in your web app."
These testimonials highlight how Inspectlet’s session replay feature can be a game-changer for businesses.
Integration Options
Inspectlet integrates seamlessly with Segment, simplifying session tagging and data collection. The Inspectlet script automatically loads on all pages, and for single-page applications, it triggers virtual page views whenever the Segment page method is called. This integration also passes along critical data – like user IDs, traits, event names, and properties – making the session recordings and heatmaps even more useful.
Pricing and Plans
Inspectlet’s pricing is straightforward, and the platform has earned a 4.2/5 rating on G2 (based on 25 reviews). Users appreciate its easy-to-use interface and clear visual data. However, some have noted limited customization options and a lack of robust real-time session analysis. These trade-offs make it an excellent choice for businesses looking for quick, actionable insights without a steep learning curve.
sbb-itb-880d5b6
7. FullStory
FullStory stands out among heatmap tools by offering a robust platform for understanding digital user experiences. Known as a Digital Experience Intelligence platform, it provides AI-powered heatmaps with up to 95% accuracy and complete session capture, delivering insights that drive actionable improvements.
Heatmap Types
FullStory includes click maps and scroll maps in its analytics toolkit, giving a clear visual representation of user engagement across a website. These heatmaps highlight how users interact with various elements and pinpoint areas where engagement levels differ. One standout feature is the rage click heatmap, which identifies frustrated clicking behaviors and uncovers hidden bugs.
Beyond rage clicks, FullStory’s heatmaps also detect other problematic interactions, like error clicks and dead clicks, offering insights that help refine user experiences. These heatmaps go beyond simple snapshot analysis by grouping URLs into "Pages" with similar structures, streamlining the process of analyzing user trends. The data can be saved and shared across teams, making collaboration easier.
Session Replay
FullStory’s session replay feature takes user interaction analysis to the next level by recording every click, scroll, and hover during a session. Its autocapture functionality ensures that all interactions are automatically recorded, and the sessions are fully indexed, making it easy to search by events, user actions, or specific elements.
The impact of these features is clear. For instance, a FinTech company improved its one-touch resolutions by 57%, while Wistia saw a 30% boost in customization engagement during onboarding.
"FullStory’s session replay and heatmap features are incredibly powerful for understanding the customer experience at a granular level. Being able to watch real user sessions and see aggregate engagement patterns helps pinpoint specific areas for UX improvements and conversion optimization. The insights have led us to make meaningful product enhancements." – Micheal J., Analytics Manager
Unlike some tools that only capture a sample of sessions, FullStory records all user sessions and caches assets to preserve historical recordings, even if website changes occur later. It’s also the only platform that provides a complete view of how users navigate across multiple browser tabs, offering unparalleled insights. These session replays can be easily integrated with other tools to enhance your analytical workflow.
Integration Options
FullStory’s integrations add another layer of utility to its detailed recording capabilities. The platform works seamlessly with tools like Adobe Analytics, Google Tag Manager, Slack, Trello, and JIRA, making it easier to incorporate into existing workflows.
For more advanced needs, FullStory offers Webhooks, JavaScript and HTTP APIs, and a Server API for server-to-server connections. It also connects with data warehouses and cloud storage solutions for deeper analysis. For example, Jumbo Interactive used Segment to set up custom events, which helped them uncover a long-overlooked error on their first day of use – a bug that had gone undetected for six months.
Pricing and Plans
FullStory offers several plans, including Enterprise, Advanced, Business, and Free options. While users appreciate its ease of implementation and robust integrations, some have noted occasional challenges with rage click tracking and handling large volumes of data.
"As a UX designer, being able to view and analyze user behaviors through session replays and funnel is invaluable. The tool’s intuitive interface makes it super easy to pinpoint where users struggle and how they navigate in real time. This direct insight helps in tweaking designs and improving UX and CX." – Israel F., VP of Design
8. VWO Insights
VWO Insights is a powerful analytics platform designed to help businesses understand user behavior through visual data and interaction tracking. Part of the VWO ecosystem, it combines heatmaps, session recordings, form insights, and conversion funnels to provide a complete picture of how users engage with a website. Its integrated tools make it easier for businesses to move from analyzing data to taking actionable steps.
Heatmap Types
VWO Insights provides four types of heatmaps to reveal how users interact with a site:
- Clickmaps: Highlight the most-clicked areas, showing which elements grab attention and which calls-to-action might be ignored.
- Scrollmaps: Indicate how far users scroll, helping identify whether important content is placed effectively.
- Click Area: Compares click activity across different sections of a page.
- Element Lists: Ranks page elements based on user engagement.
These heatmaps use color coding for quick interpretation and allow filtering by visitor type, device, browser, or location.
A great example of its effectiveness comes from Galeton, which used VWO Insights’ heatmaps to optimize their navigation bar, resulting in a 14% increase in sitewide conversions.
Session Replay
The session replay feature records every user interaction, including mouse movements, scrolling, and clicks, creating detailed replays of user journeys. These recordings help businesses pinpoint drop-off points and uncover barriers to conversion.
To make analysis even sharper, recordings can be filtered by location, device type, or specific behaviors, allowing businesses to focus on targeted user segments. Privacy controls ensure sensitive data is anonymized, so companies can maintain compliance while still gaining valuable insights.
Real-world examples reinforce its impact. Bear Mattress identified and resolved UX issues in their "Popular Products" section using session replays, boosting revenue by 16.21%. Similarly, Truckstop reviewed over 1,000 session recordings to generate A/B testing ideas, leading to a 26% increase in conversions.
"We ran a series of A/B tests based on the data we gathered by using Heatmaps, Scrollmaps and Surveys available on the VWO Platform. It helped us to identify key elements on our websites that needed a deeper look." – Jenny Hughes, Digital Marketing Lead
Integration Options
VWO Insights integrates seamlessly with the broader VWO platform, which includes tools for testing, personalization, and feature rollouts. This integration allows businesses to move directly from identifying issues with heatmaps or session replays to implementing A/B tests or personalization strategies to address those problems.
"I was able to infer how visitors use the site (heat maps, visitor-recordings etc) and even how they feel (surveys). Gleaning insights from these data, I could strategize and easily launch A/B tests, multivariate tests, personalization triggers and more to optimize our funnel." – Divakar Ravichandran, Onsite merchandising team
This tight integration makes VWO Insights stand out by connecting user behavior insights directly to optimization strategies.
Pricing and Plans
VWO Insights is positioned as a premium tool, starting at $169 per feature, per month. Pricing is based on the number of monthly tracked users, with costs for 50,000 monthly visitors ranging between $355 and $1,326 per month, depending on the plan and features. According to Vendr data, the median buyer spends $17,543 annually, with prices ranging from $7,200 to $40,548 per year.
While the platform offers a free trial and a limited free version, accessing its full capabilities requires a paid subscription. Some users have noted that the costs can add up, especially for high-traffic websites or when combining multiple modules.
"The cost of VWO can get pretty steep when combining multiple modules or when implemented on higher traffic websites." – Nicky R., UX/UI architect
Despite pricing concerns, VWO Insights remains popular for its robust feature set, earning a 4.2 out of 5-star rating from 59 reviews on G2.
9. Lucky Orange
Lucky Orange is a user behavior analytics tool trusted by over 500,000 websites. It combines powerful features like heatmaps, session recordings, and live chat to give businesses real-time insights into how visitors interact with their sites. Unlike many other tools, Lucky Orange includes all features in every plan, removing the common frustration of limited access based on pricing tiers.
Heatmap Types
Lucky Orange offers three main types of heatmaps, each designed to highlight specific user interactions:
- Click Heatmaps: These show exactly where visitors click, helping businesses understand which calls-to-action are working.
- Scroll Heatmaps: These reveal how far users scroll down a page, pinpointing the "effective fold" – the spot where 50% of visitors stop scrolling.
- Move Heatmaps: These track mouse movements to show which parts of the page grab the most attention.
What sets Lucky Orange apart is its dynamic heatmaps, which capture interactions with elements like pop-ups, sliders, dropdowns, and carousels. This ensures no user action goes unnoticed, unlike static heatmaps. Heatmaps can also be filtered by traffic source or device type, making it easy to spot issues specific to mobile, tablet, or desktop users.
For instance, Runway Health, an e-commerce brand in the beauty and personal care space, used Lucky Orange’s heatmaps to identify high-engagement areas. By redesigning their pages to focus on these key spots – especially around forms and call-to-action buttons – they improved the customer journey and saw higher conversion rates. Similarly, Celerity India Marketing Services paired heatmaps with A/B testing during a B2B ad campaign. This approach led to a noticeable boost in user engagement and a fourfold increase in their client’s ROI within two months.
On top of heatmaps, Lucky Orange’s session replay feature provides even deeper insights.
Session Replay
With session recordings, Lucky Orange captures every click, scroll, and form interaction. What makes it even more powerful is its live session viewing feature, which allows businesses to watch visitor behavior in real time. When paired with integrated live chat, businesses can directly engage with users as they browse, addressing questions or concerns on the spot.
The platform automatically organizes recordings based on factors like high cart value, abandoned carts, traffic sources, and even visitor frustration levels. These recordings can be shared with team members, making it easier to collaborate on solutions.
Real-world examples show the value of session replays. One e-commerce business identified issues with form errors and unclear payment instructions, leading them to simplify the checkout process and add helpful tooltips. This reduced cart abandonment and boosted conversions. In another case, a software company noticed users struggling to find a new feature. By repositioning it more prominently, they significantly improved engagement.
Integration Options
Lucky Orange integrates effortlessly with modern website frameworks and builders, including single-page applications (SPAs), without requiring extra setup. It also works well alongside other analytics tools, allowing businesses to combine heatmaps, session recordings, and surveys for a more complete picture of user behavior.
Pricing and Plans
Lucky Orange uses a session-based pricing model, which differs from competitors that often rely on daily sessions or revenue-based structures. The platform includes all features in every plan, ensuring no tiered limitations. Its pricing options include:
- Free Plan: $0/month for 100 sessions with 30-day data storage
- Build Plan: $39/month for 5,000 sessions with 60-day data storage
- Grow Plan: $89/month for 15,000 sessions
- Expand Plan: $229/month for 45,000 sessions
- Scale Plan: $899/month for 300,000 sessions
- Enterprise Options: Custom pricing for 700,000+ sessions, with dedicated support and prioritized feature requests
Lucky Orange enjoys high user satisfaction, earning a 4.7 out of 5 on Capterra (based on 250 reviews) and 4.6 out of 5 on G2 (from 235 reviews). Users frequently highlight its robust features, ease of use, and responsive customer support. However, some note that costs can climb for websites with very high traffic volumes.
Feature Comparison
Choosing the right heatmap tool often comes down to understanding its features and how they align with your business needs. Below is a table that highlights key features and pricing to help you make an informed decision.
Heatmap tools offer a variety of heatmap types, such as click tracking (showing where users click or tap), scroll maps (indicating how far users scroll), movement tracking (capturing navigation patterns), attention maps (highlighting areas of focus), and rage-click detection (pinpointing frustration points). Session replay capabilities vary from basic recordings to advanced, AI-driven insights. For example, FullStory uses AI to provide automated analysis, while Lucky Orange allows businesses to monitor visitor behavior in real-time. Microsoft Clarity stands out by offering unlimited session replays at no cost, regardless of site traffic or the number of domains tracked. Meanwhile, Hotjar retains user data for up to a year, giving businesses ample time to analyze and act on insights.
Integration options are another important factor, as they help streamline data analysis. Most tools connect with popular platforms like Google Analytics, Shopify, WooCommerce, BigCommerce, Salesforce, and HubSpot, enabling businesses to combine quantitative data with visual insights seamlessly.
| Tool | Heatmap Types | Session Replay | Key Integrations | Starting Price |
|---|---|---|---|---|
| Hotjar | Click, scroll, movement, engagement, rage-click | Yes, with surveys and user testing | HubSpot, Salesforce, Google Analytics, Segment, Slack | $39/month |
| Crazy Egg | Click, scroll, confetti, overlay | Limited | Google Analytics, WordPress, Shopify | $29/month |
| Microsoft Clarity | Click, scroll, movement | Yes, unlimited free | Google Analytics, Power BI, WordPress, Shopify, Jira | Free |
| Mouseflow | 6 types: click, scroll, movement, real-time, geographic, attention | Records all visitors | Google Ads, HubSpot, WordPress, Shopify, WooCommerce | $31/month |
| FullStory | Standard heatmap tracking | Features AI-powered session summaries | Google Analytics, Mixpanel, Jira, Zendesk, Intercom | Contact for pricing |
| VWO Insights | Dynamic, click, scroll, click area reports | Yes | Salesforce, HubSpot, Google Analytics | $199/month |
| Lucky Orange | Real-time heatmaps | Live tracking with real-time view | HubSpot, Salesforce, Shopify, WooCommerce, BigCommerce | $39/month |
The choice of tool depends on your goals. For those new to heatmap analysis, Microsoft Clarity offers a completely free option to explore user behavior without financial commitment. On the other hand, established businesses might lean toward FullStory for its AI-driven insights or Lucky Orange for real-time tracking, depending on whether automation or live engagement is the priority. These feature comparisons provide a solid starting point for evaluating how each tool fits within your budget and operational needs.
Pricing Comparison
Heatmap tools span a wide range of pricing, from free options to enterprise-level solutions. When considered alongside the features discussed earlier, this overview can help you pinpoint the most cost-effective option for your specific needs.
Some tools, like Microsoft Clarity, stand out with completely free and unrestricted plans. Others, such as Hotjar, Inspectlet, Lucky Orange, and FullStory, offer limited free tiers. For instance, Hotjar’s free plan allows for 35 daily session recordings, while FullStory provides up to 10,000 sessions with one year of data storage.
Here’s a quick look at pricing across different tiers – free, entry-level, and enterprise:
- Entry-level plans: These typically cost $29 to $39 per month (with annual billing). For example:
- Crazy Egg offers a $29/month plan that includes five heatmap reports, 50 recordings, and up to 5,000 monthly pageviews.
- Mouseflow and Lucky Orange start at around $31–$32/month.
- Hotjar charges between $32 and $39/month for its entry-level plans.
- Premium and enterprise solutions: Tools like VWO Insights, Glassbox, and FullStory cater to businesses with higher traffic demands or complex analytics needs. These typically require contacting sales teams for custom pricing.
Payment and Session Limits
Payment structures vary by provider. For example, Crazy Egg requires annual billing after a 30-day trial, while most platforms offer both monthly and annual payment options, often with discounts of 10–20% for annual commitments.
Session tracking limits are another key factor. Basic plans often cap tracking between 5,000 and 10,000 sessions per month, while higher-tier plans may support 50,000 sessions or even offer unlimited tracking. Some tools maintain the same features across all plans, with only session limits differing. Others reserve advanced features for more expensive tiers.
Additional Costs and Considerations
Be mindful of potential extra charges. For instance:
- Hotjar charges separately for its feedback and survey tools, regardless of the plan.
- Lower-tier plans may limit data retention, requiring upgrades for longer-term analysis.
Recommendations by Use Case
- Beginners: Microsoft Clarity offers an excellent free option for getting started.
- Small organizations: Tools like Crazy Egg, Mouseflow, Inspectlet, or Lucky Orange provide affordable plans with sufficient features.
- Larger enterprises: Advanced tools like VWO Insights, Glassbox, or FullStory are better suited for handling complex needs and high traffic volumes.
| Tool | Free Plan | Entry Price | Mid-Tier Price | Enterprise |
|---|---|---|---|---|
| Microsoft Clarity | Unlimited free | N/A | N/A | Free |
| Crazy Egg | 30-day trial only | $29/month | Higher tiers available | Custom |
| Hotjar | 35 daily recordings | $32–39/month | ~$213/month | Custom |
| Mouseflow | Yes | ~$31/month | Higher tiers available | Custom |
| Lucky Orange | Yes | ~$32/month | Higher tiers available | Custom |
| Inspectlet | Yes | ~$39/month | Higher tiers available | Custom |
| FullStory | Free plan (10K sessions, 1-year storage) | N/A | N/A | Custom |
| VWO Insights | Up to 5,000 visitors/month free | $199/month | Higher tiers available | Custom |
| Glassbox | N/A | Contact for pricing | N/A | Custom |
Advantages and Disadvantages
Here’s a breakdown of the strengths and weaknesses of each tool, helping you decide which fits your needs for improving SEO and understanding user behavior.
Microsoft Clarity stands out as a completely free option with an easy setup process, making it a great choice for beginners or businesses on a tight budget looking to analyze user engagement.
Hotjar combines user-friendly heatmaps with built-in feedback tools for qualitative insights. However, some users have noted that it might slow down website performance during data collection.
Crazy Egg offers a straightforward and organized interface, making it accessible for users of all experience levels. It’s particularly effective for simple conversion funnel analysis, though it lacks some advanced features.
Lucky Orange features an intuitive interface and dynamic heatmaps that capture real-time interactions. However, its pricing increases with higher traffic, which could be a drawback for rapidly growing businesses.
Mouseflow provides extensive behavior insights through six different heatmap types, all without a steep learning curve. On the downside, its interface design feels outdated to some users.
FullStory delivers powerful analytics with highly detailed reporting, making it ideal for large organizations. However, its abundance of features may overwhelm beginners or smaller teams.
Inspectlet is a solid choice for basic session recordings, offering reliability for simpler needs. That said, it doesn’t include as many advanced features as some competitors.
VWO Insights and Glassbox cater to enterprise clients, offering advanced analytics and AI-driven insights. While both are excellent for handling complex requirements, they require custom pricing discussions and can take longer to implement.
| Tool | Key Strengths | Main Weaknesses | Best For |
|---|---|---|---|
| Microsoft Clarity | Free, easy to set up | Limited customization options | Beginners, budget-conscious users |
| Hotjar | Simple interface, feedback tools | May slow website performance | Small to medium-sized businesses |
| Crazy Egg | Easy to use, reliable | Lacks advanced features | Simple conversion analysis needs |
| Lucky Orange | Real-time heatmaps, fast deployment | Costs rise with traffic volume | Growing businesses |
| Mouseflow | Multiple heatmap types, easy to use | Outdated interface | Comprehensive data needs |
| FullStory | Detailed analytics, powerful features | Overwhelming for beginners | Large teams or enterprises |
| Inspectlet | Dependable session recordings | Fewer advanced tools | Basic and budget-friendly needs |
| VWO Insights | Advanced analytics, AI tools | Custom pricing, longer setup | High-traffic enterprises |
| Glassbox | Secure, enterprise-grade analytics | No upfront pricing | Enterprise-level organizations |
This comparison highlights the strengths and weaknesses of each tool, helping you choose the one that best matches your business goals and SEO strategies. Picking the right platform can make a big difference in understanding user behavior and improving conversions.
Conclusion
After comparing features and pricing, the choice of a heatmap tool comes down to your business size, budget, and specific needs. The data shows clear patterns that can simplify the decision-making process.
For startups or businesses working with limited budgets, Microsoft Clarity is an excellent starting point. It’s completely free and boasts a high user rating of 4.8/5. While it doesn’t offer advanced features like interactive element analysis, it covers the basics of heatmap functionality without any financial commitment. Another solid option for startups is Lucky Orange, priced at $19/month. It offers additional features at an affordable rate, making it ideal for growing businesses.
Small to medium-sized businesses have a variety of strong contenders in the $29–55/month price range. Crazy Egg, at $29/month, provides a well-rounded package of visual analytics and integrated A/B testing, making it perfect for teams focused on improving conversions. Hotjar, priced at $32/month, combines robust heatmap generation – over 7.5 million heatmaps – with a solid user rating of 4.6/5 [103, 118]. For example, Microfocus achieved a 12.37% increase in form sign-ups by using VWO Insights to identify issues like missing asterisk marks on required fields and poorly placed CTAs. These tools strike a great balance between affordability and functionality.
For enterprise-level organizations, tools like VWO Insights, FullStory, and Glassbox are worth considering. These platforms offer advanced analytics, AI-powered insights, and the ability to manage large-scale traffic. While pricing often requires custom discussions, they deliver the scalability and features necessary for larger teams. For instance, VWO Insights starts at $199/month and includes dynamic heatmap analysis alongside advanced session recording capabilities.
Research backs up the value of heatmapping, with teams that use these tools seeing up to a 16% improvement in optimization success rates. This underscores how impactful these insights can be.
When choosing a tool, focus on ease of implementation, compatibility with your tech stack, and the type of insights your business needs. Whether you’re tracking scroll depth, click behavior, or conversion funnel performance, there’s a heatmap solution tailored to your budget and goals.
FAQs
What should I look for when selecting a heatmap tool for my business?
When choosing a heatmap tool for your business, prioritize user-friendliness, the variety of heatmaps it offers (like click, scroll, or movement maps), and how seamlessly it integrates with your website or app. Make sure the tool delivers reliable data and meets your analytics and privacy requirements.
You’ll also want to factor in pricing, compatibility with your current tools, and whether its features align with your business objectives. Many tools provide free trials or demos – use these opportunities to explore their capabilities before making a decision.
How do session replays complement heatmaps for better user insights?
Session replays work hand-in-hand with heatmaps to give you a clearer picture of how users engage with your website. While heatmaps show overall behavior trends, session replays let you zoom in on individual user actions – like clicks, scrolling, and navigation paths – providing a more granular perspective.
When you use heatmaps alongside session replays, you can uncover specific pain points, gain insights into how users make decisions, and make focused changes to improve your website’s user experience.
What are the benefits of using a free tool like Microsoft Clarity compared to paid heatmap tools?
Microsoft Clarity provides completely free tools like heatmaps and session recordings, making it a fantastic option for businesses looking to save money or those just starting with website analytics. With no costs involved, it delivers essential insights into how users interact with your site.
Although it doesn’t include some of the more advanced features you’d find in paid tools, Clarity stands out for being simple to navigate, mindful of privacy, and effective when it comes to evaluating website performance. It’s an ideal choice for small to medium-sized businesses or anyone seeking a dependable, cost-free analytics platform.

