Core Web Vitals are essential for improving website performance and user experience. They focus on Largest Contentful Paint (LCP), First Input Delay (FID), and Cumulative Layout Shift (CLS) – metrics that directly impact SEO and user satisfaction. Here’s how you can test them for free:
Key Tools to Test Core Web Vitals:
- PageSpeed Insights: Analyze performance with field and lab data.
- Chrome DevTools: Debug performance issues in real time.
- Lighthouse: Generate detailed performance reports.
- Web Vitals Extension: Monitor live metrics while browsing.
- Google Search Console: View site-wide performance trends.
Quick Comparison of Tools:
| Tool Name | Best For | Key Feature |
|---|---|---|
| PageSpeed Insights | Detailed analysis | Combines field and lab data |
| Chrome DevTools | Technical debugging | Real-time performance tracking |
| Lighthouse | Deep insights | Actionable recommendations |
| Web Vitals Extension | Quick monitoring | Live performance feedback |
| Search Console | Site-wide insights | Aggregated performance data |
Why It Matters:
- Poor Core Web Vitals can hurt SEO rankings, increase bounce rates, and reduce user engagement.
- For example, a 1-second delay can lower conversions by 7%.
Start testing today to identify issues and improve your website’s performance!
Master Core Web Vitals: Essential Tips & Free Tools
Free Testing Tools
There are several free tools available to measure Core Web Vitals. These tools provide different features and insights to help you evaluate your website’s performance effectively.
PageSpeed Insights
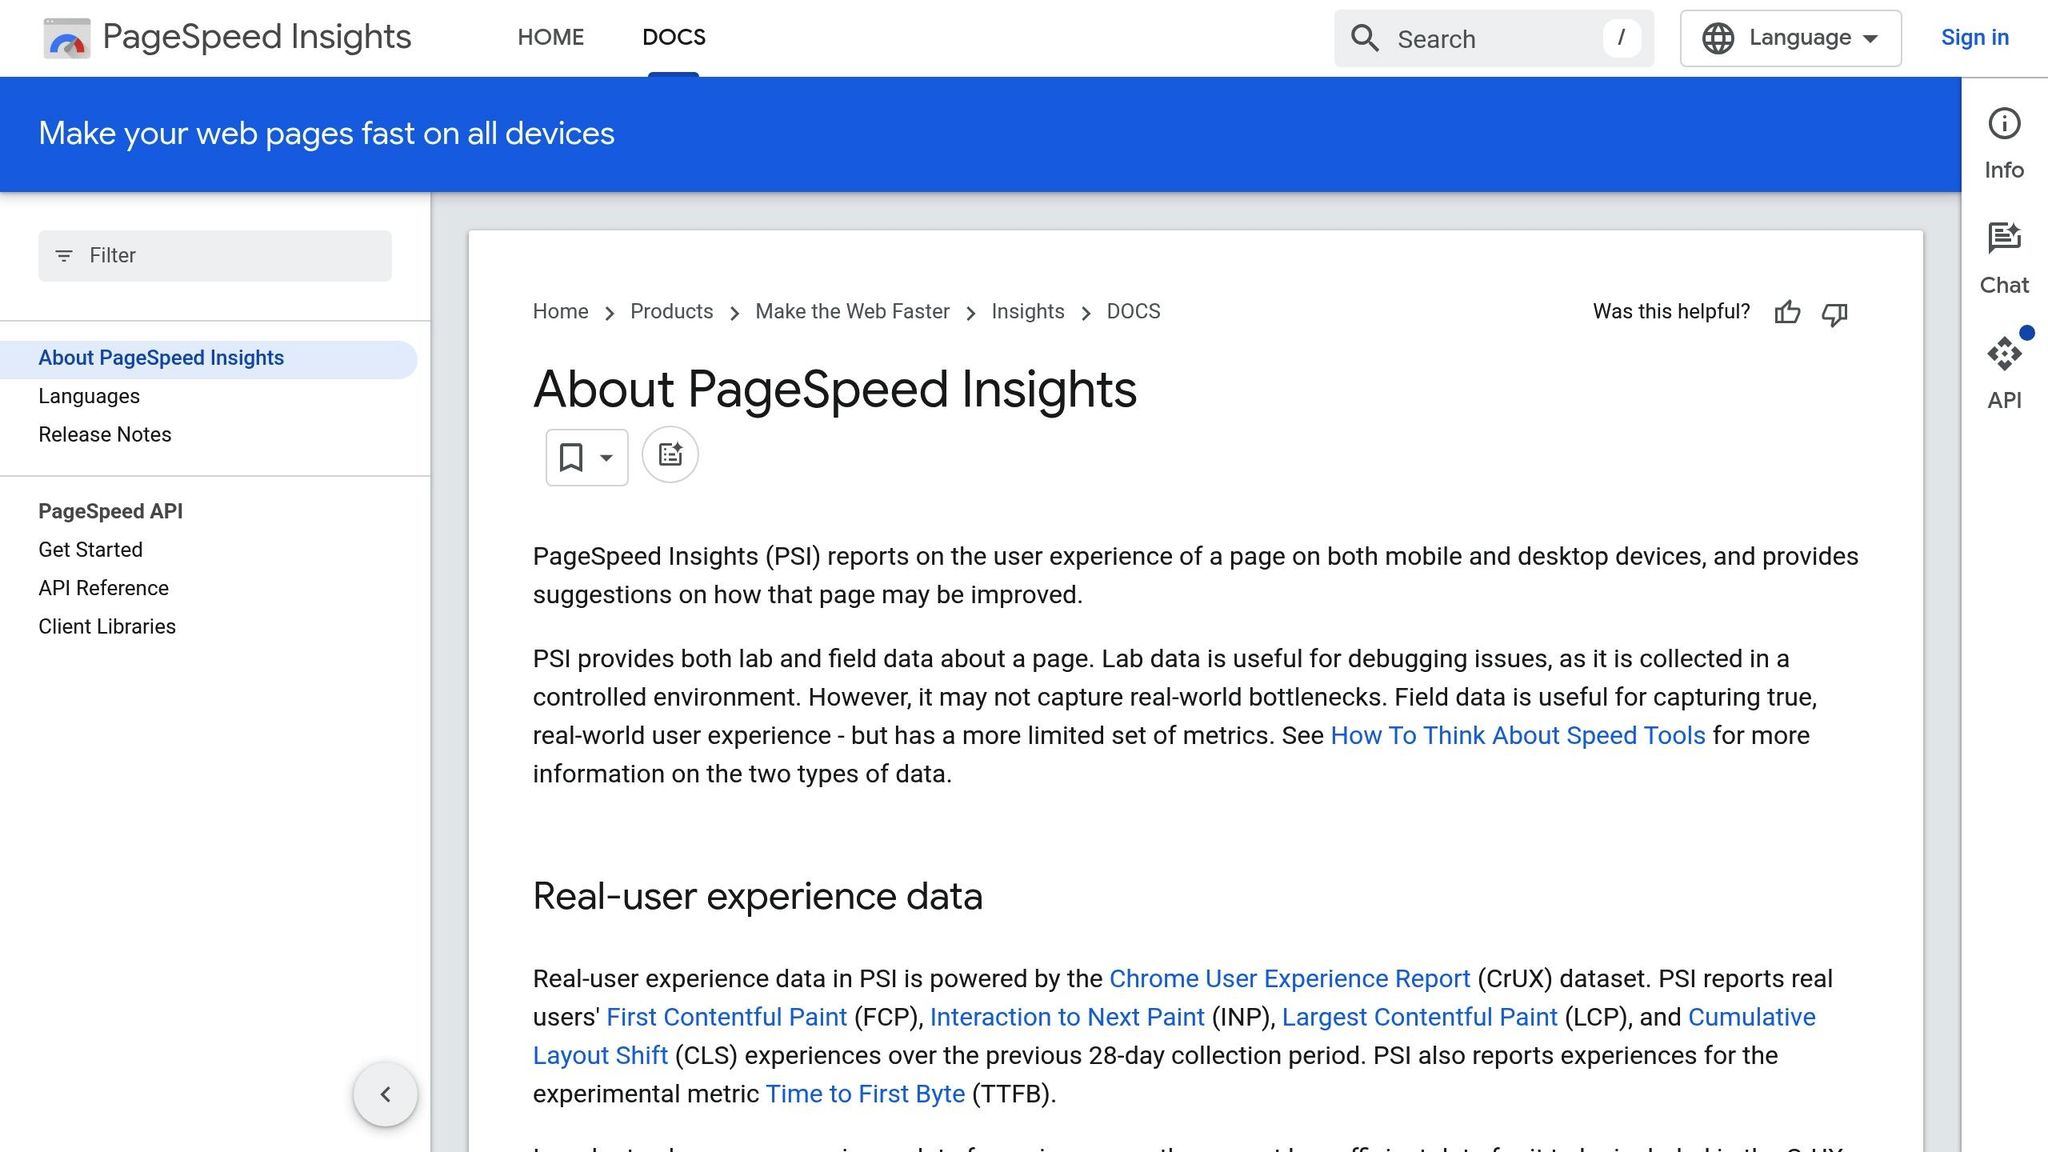
PageSpeed Insights offers a detailed analysis of Core Web Vitals with just a URL input. It combines real-world user data from the Chrome User Experience Report (CrUX) with lab data collected in controlled conditions. Enter your website’s URL to get metrics and tailored recommendations for both mobile and desktop versions.
Chrome DevTools
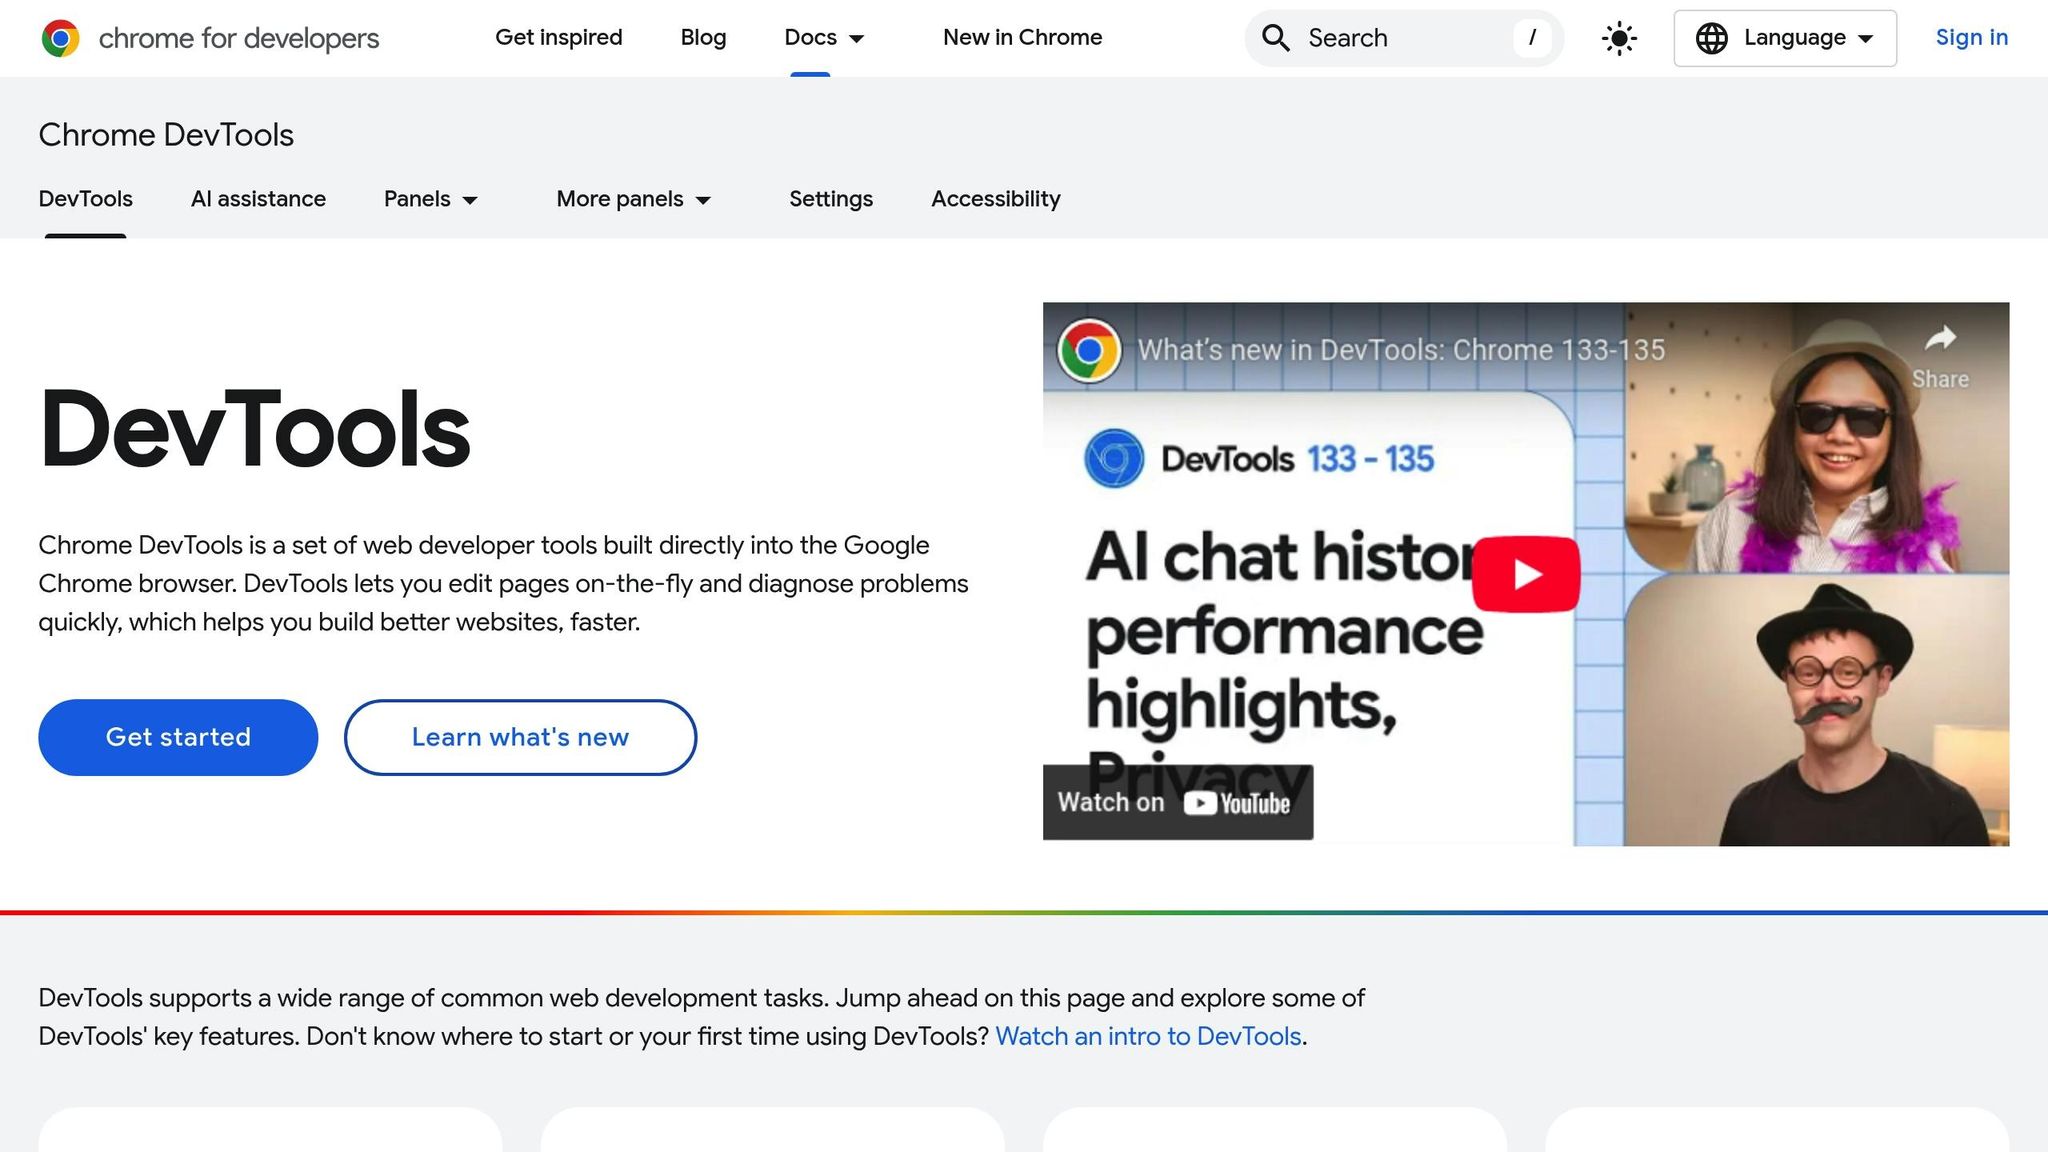
Chrome DevTools has built-in tools for monitoring performance. To check Core Web Vitals:
- Open Chrome DevTools (press F12 or right-click and select "Inspect").
- Go to the Performance tab.
- Click the reload button to record page load performance.
- Look for Core Web Vitals badges in the Experience section.
This tool provides detailed timing data and identifies specific elements affecting performance.
Lighthouse
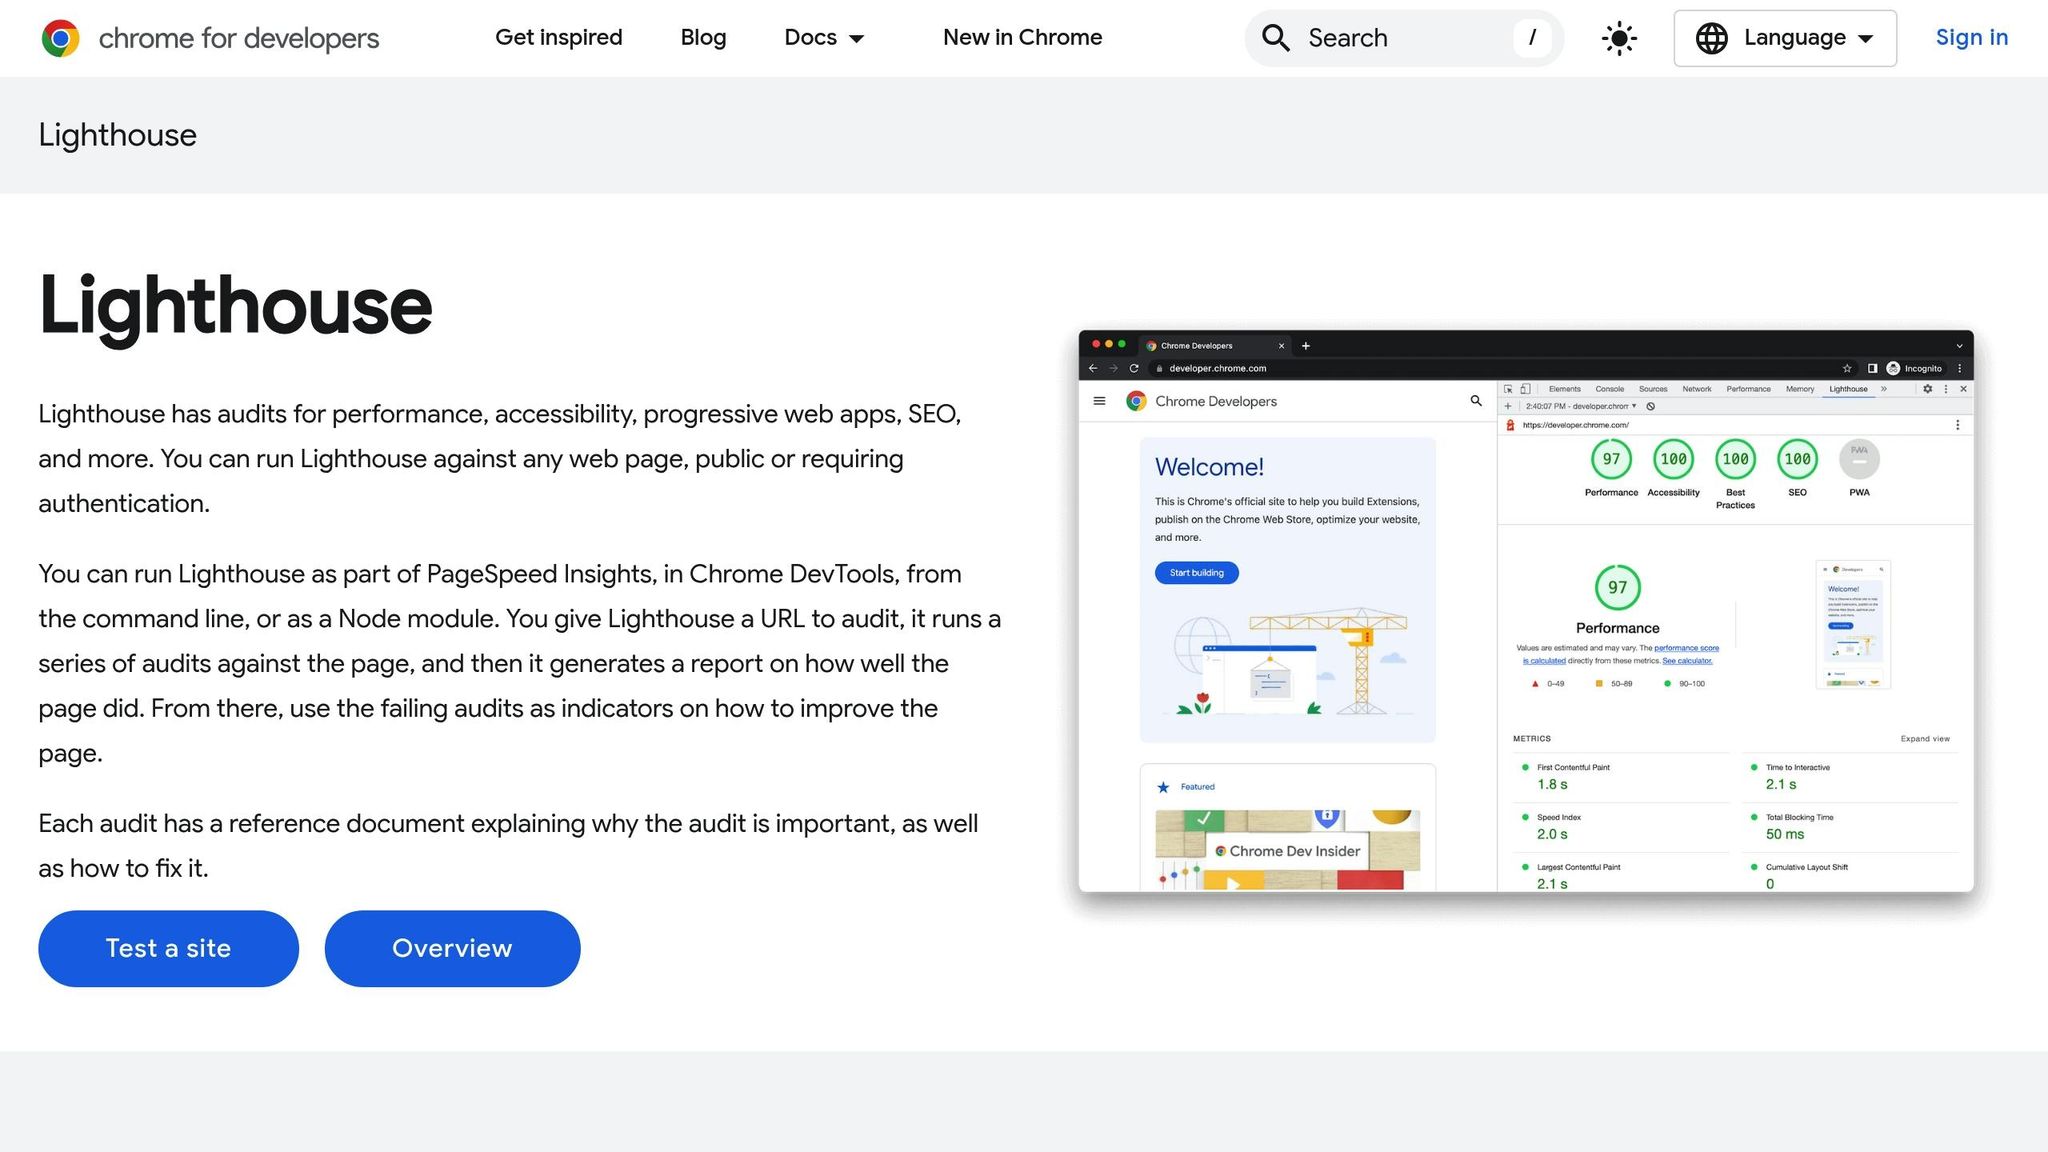
Lighthouse, integrated into Chrome DevTools, generates in-depth performance reports, including Core Web Vitals. To use Lighthouse:
- Open Chrome DevTools.
- Select the Lighthouse tab.
- Choose "Performance" and your preferred device type.
- Click Generate report.
The report includes scores for each metric and practical tips for improvement.
Web Vitals Extension
The Web Vitals Chrome extension tracks Core Web Vitals in real time while you browse. After installing the extension:
- Click the extension icon in your browser.
- Enable the "Show Core Web Vitals overlay" option.
- Visit any webpage to see live performance metrics.
The extension uses color-coded indicators: green for good, orange for needs improvement, and red for poor performance.
Search Console
Google Search Console provides a site-wide view of Core Web Vitals. To access this data:
- Open the Core Web Vitals report under the "Experience" section.
- Review URL performance grouped by status.
- Check mobile and desktop metrics separately.
This report highlights problem URLs and groups similar issues, helping you prioritize fixes.
| Tool Name | Best For | Key Feature |
|---|---|---|
| PageSpeed Insights | Detailed Analysis | Combines field and lab data |
| Chrome DevTools | Technical Debugging | Real-time performance tracking |
| Lighthouse | Comprehensive Reports | Actionable recommendations |
| Web Vitals Extension | Quick Monitoring | Instant visual feedback |
| Search Console | Site-Wide Insights | Aggregated performance data |
Testing Process Guide
Here’s a step-by-step guide to testing your Core Web Vitals using various tools.
PageSpeed Insights Steps
To use PageSpeed Insights:
- Enter your URL and let the tool analyze mobile and desktop data.
- Focus on these four key areas:
- Lab Data: Results from a controlled test environment.
- Field Data: Metrics from real users over the past 28 days.
- Opportunities: Suggestions for improvements with estimated time savings.
- Diagnostics: Technical details to address specific issues.
Run tests at different times to account for performance fluctuations. Check the "Core Web Vitals Assessment" for pass/fail results on each metric.
DevTools Testing Method
Chrome DevTools offers detailed performance insights through its Performance panel:
- Open DevTools and go to the Performance tab.
- Enable advanced rendering instrumentation, then click record and reload the page.
- Stop recording once the page fully loads.
- Check the Experience section for Core Web Vitals markers.
Pay attention to colored flags in the timeline – red flags indicate urgent issues. The Performance tab also breaks down frames, helping you pinpoint elements causing delays or layout shifts.
Afterward, create a Lighthouse report for a deeper analysis.
Lighthouse Report Creation
To generate a Lighthouse report:
- Open Lighthouse in Chrome DevTools.
- Choose your test settings (device, throttling, performance) and click "Generate Report."
- Review the 0-100 performance score.
- Look at the "Opportunities" section for prioritized fixes.
Extension Usage Guide
For real-time insights, use the Core Web Vitals extension:
- Open the page you want to analyze.
- Check the color-coded metrics:
- Green: Good performance.
- Yellow: Needs improvement.
- Red: Poor performance.
The extension updates metrics live as you interact with the page, making it ideal for spotting issues with dynamic content.
Search Console Data Analysis
To examine Core Web Vitals in Google Search Console:
- Go to the Experience section.
- Open the "Core Web Vitals" report.
- Review URLs grouped by performance:
- Poor
- Needs Improvement
- Good
Focus on URLs marked "Poor." The report clusters similar issues, making it easier to address them efficiently.
| Testing Phase | Time Required | Key Focus Areas |
|---|---|---|
| PageSpeed Insights | 2-3 minutes | Performance score, actionable recommendations |
| DevTools Analysis | 5-10 minutes | Frame-level performance, rendering problems |
| Lighthouse Report | 3-5 minutes | Detailed metrics, optimization suggestions |
| Extension Monitoring | Continuous | Live performance tracking during interactions |
| Search Console Review | 15-20 minutes | Broad site performance trends and problem areas |
Understanding Test Results
Performance Rating Scale
Core Web Vitals use a three-level rating system to measure your site’s performance. Each metric has specific thresholds:
| Metric | Good | Needs Improvement | Poor |
|---|---|---|---|
| LCP | 0-2.5 seconds | 2.5-4.0 seconds | > 4.0 seconds |
| FID | 0-100ms | 100-300ms | > 300ms |
| CLS | 0-0.1 | 0.1-0.25 | > 0.25 |
To pass the Core Web Vitals assessment, a page must achieve "Good" scores across all three metrics. These scores are calculated using the 75th percentile of all page loads, meaning your page must meet these thresholds for at least 75% of user visits.
Metric Score Analysis
Here’s how to interpret and address each metric:
Largest Contentful Paint (LCP)
LCP measures how quickly the largest visible content, such as a hero image, main heading, or banner text, loads on the page. Check the Diagnostics section for elements causing delays.
First Input Delay (FID)
FID evaluates how quickly your site responds to user interactions. Focus on "Total Blocking Time" in lab data, as it often correlates with FID. High blocking times typically indicate heavy JavaScript execution.
Cumulative Layout Shift (CLS)
CLS tracks unexpected layout shifts during page load. Common causes include:
- Images loading without defined dimensions
- Dynamic content being inserted
- Fonts causing layout adjustments
- Ad spaces shifting content
Use DevTools to analyze layout shifts and identify patterns.
Problem Detection
To pinpoint performance issues, follow these steps:
1. Cross-Reference Multiple Tools
Use various tools like PageSpeed Insights and Chrome DevTools to confirm problem areas. For example, if PageSpeed Insights flags poor LCP, use DevTools to identify which elements are causing delays.
2. Compare Mobile and Desktop Scores
Performance often varies between mobile and desktop. Pay attention to:
- Connection speeds
- Resource loading differences
- Layout variations
- JavaScript execution times
3. Review Historical Data
Search Console’s Core Web Vitals report provides performance trends over time. Look for:
- Sudden dips in performance
- Persistent problem areas
- Links to recent site changes
- Patterns in traffic impact
Keep in mind that lab data is controlled, while field data reflects actual user experiences.
Score Improvement Methods
LCP Optimization Steps
To improve Largest Contentful Paint (LCP), it’s essential to focus on speeding up server response times and ensuring resources load efficiently. Here are some actionable strategies:
Server Optimization
- Use server-side caching to cut down Time to First Byte (TTFB).
- Deploy a Content Delivery Network (CDN) to deliver resources faster.
- Enable HTTP/2 or HTTP/3 for better connection handling.
- Streamline database queries to improve server response.
Resource Loading
- Preload critical assets with
<link rel="preload">tags. - Compress images into WebP format without losing quality.
- Apply lazy loading for images that appear below the fold.
- Defer non-critical CSS and JavaScript to minimize render-blocking resources.
Image Optimization
- Resize images to match their display dimensions.
- Use responsive images with
srcsetandsizesattributes. - Convert decorative images into CSS backgrounds where possible.
- Enable progressive loading for large hero images.
FID Enhancement Tips
Improving First Input Delay (FID) revolves around optimizing JavaScript execution and resource management. Here are some effective approaches:
JavaScript Optimization
- Split large JavaScript bundles into smaller, manageable chunks.
- Defer the execution of non-critical JavaScript.
- Remove unused JavaScript through code splitting.
- Use
requestIdleCallbackfor non-essential operations.
Resource Prioritization
- Load third-party scripts asynchronously.
- Reduce main thread blocking by leveraging Web Workers.
- Lower JavaScript execution time during the initial page load.
- Apply route-based code splitting for single-page applications.
Event Handling
- Fine-tune event listeners to minimize input delays.
- Eliminate unnecessary event handlers.
- Use debouncing or throttling for resource-heavy operations.
- Implement passive event listeners to improve performance.
These adjustments help reduce delays and prepare the groundwork for addressing layout shifts, which are covered next.
CLS Reduction Tactics
To minimize Cumulative Layout Shift (CLS), focus on maintaining content stability. Here’s how:
Image Handling
- Always define width and height attributes for images.
- Use aspect ratio boxes to reserve space for loading content.
- Add placeholders for images while they load.
- Avoid resizing images dynamically after they’ve loaded.
Font Management
- Preload essential web fonts.
- Use
font-display: optionalfor non-critical fonts. - Set up local font fallbacks.
- Cache web fonts for returning visitors to improve load times.
Layout Stability
- Reserve space for dynamic content like ads or embeds.
- Avoid inserting new content above existing elements.
- Use transform animations instead of properties that trigger layout recalculations.
- Assign fixed sizes to containers for dynamic elements.
Ad Space Management
- Allocate space in advance for ad units.
- Use static ad sizes whenever possible.
- Properly configure sticky ads with fixed positioning.
- Prevent content from shifting when ads load.
These techniques ensure your site remains stable and user-friendly. Regular testing with free tools mentioned earlier in this guide can help you track progress and maintain improvements over time.
Conclusion
Main Takeaways
Using free tools like PageSpeed Insights, Chrome DevTools, Lighthouse, Web Vitals Extension, and Search Console Reports can help you measure and improve your website’s performance. These tools focus on the three key metrics: Largest Contentful Paint (LCP), First Input Delay (FID), and Cumulative Layout Shift (CLS). Each tool serves a unique purpose:
- PageSpeed Insights: Provides performance scores and actionable recommendations.
- Chrome DevTools: Helps with real-time debugging.
- Lighthouse: Offers detailed performance audits.
- Web Vitals Extension: Monitors performance continuously.
- Search Console: Tracks site-wide trends and highlights problem areas.
Testing is most effective when combined with a regular schedule for reviews and improvements.
Action Plan
Follow this schedule to maintain strong Core Web Vitals scores:
1. Weekly Performance Monitoring
Run weekly tests with tools like PageSpeed Insights and the Web Vitals Extension. This helps you spot and address issues early, ensuring they don’t hurt your rankings.
2. Monthly Comprehensive Audits
Use Lighthouse and Chrome DevTools monthly to dive deeper into:
- Server response times
- Resource loading efficiency
- Layout stability
- JavaScript execution
3. Quarterly Strategy Review
Every three months, analyze Search Console data to:
- Monitor long-term performance trends
- Spot patterns in user experience metrics
- Update optimization strategies based on new data
- Focus on improving poorly performing pages