Want faster websites and better search rankings? JavaScript might be slowing you down.
Core Web Vitals – Google’s key metrics for user experience – focus on loading speed (LCP), interactivity (INP), and visual stability (CLS). Slow JavaScript execution is a common culprit behind poor scores, causing delays in loading, interacting, and rendering.
Here’s the quick fix:
- Target Metrics: LCP < 2.5s, INP < 200ms, CLS < 0.1.
- Optimize JavaScript: Minify, compress, and remove unused code.
- Smart Loading: Use
defer/asyncattributes and lazy load third-party scripts. - Efficient Code: Reduce DOM manipulations, break tasks into chunks, and optimize event handling.
Tools like Google PageSpeed Insights, Lighthouse, and Chrome DevTools help identify slow scripts and measure improvements. For example, cutting LCP by 1 second can boost conversions by 11%.
Take action now. Faster JavaScript means happier users, higher rankings, and better revenue.
Fix Minimize Main Thread Work: Improve Core Web Vitals To 100 Scores
How to Measure and Find JavaScript Execution Time Problems
To tackle JavaScript delays, you need tools that highlight slow scripts and reveal their impact on Core Web Vitals.
Using Google PageSpeed Insights, Lighthouse, and GTmetrix
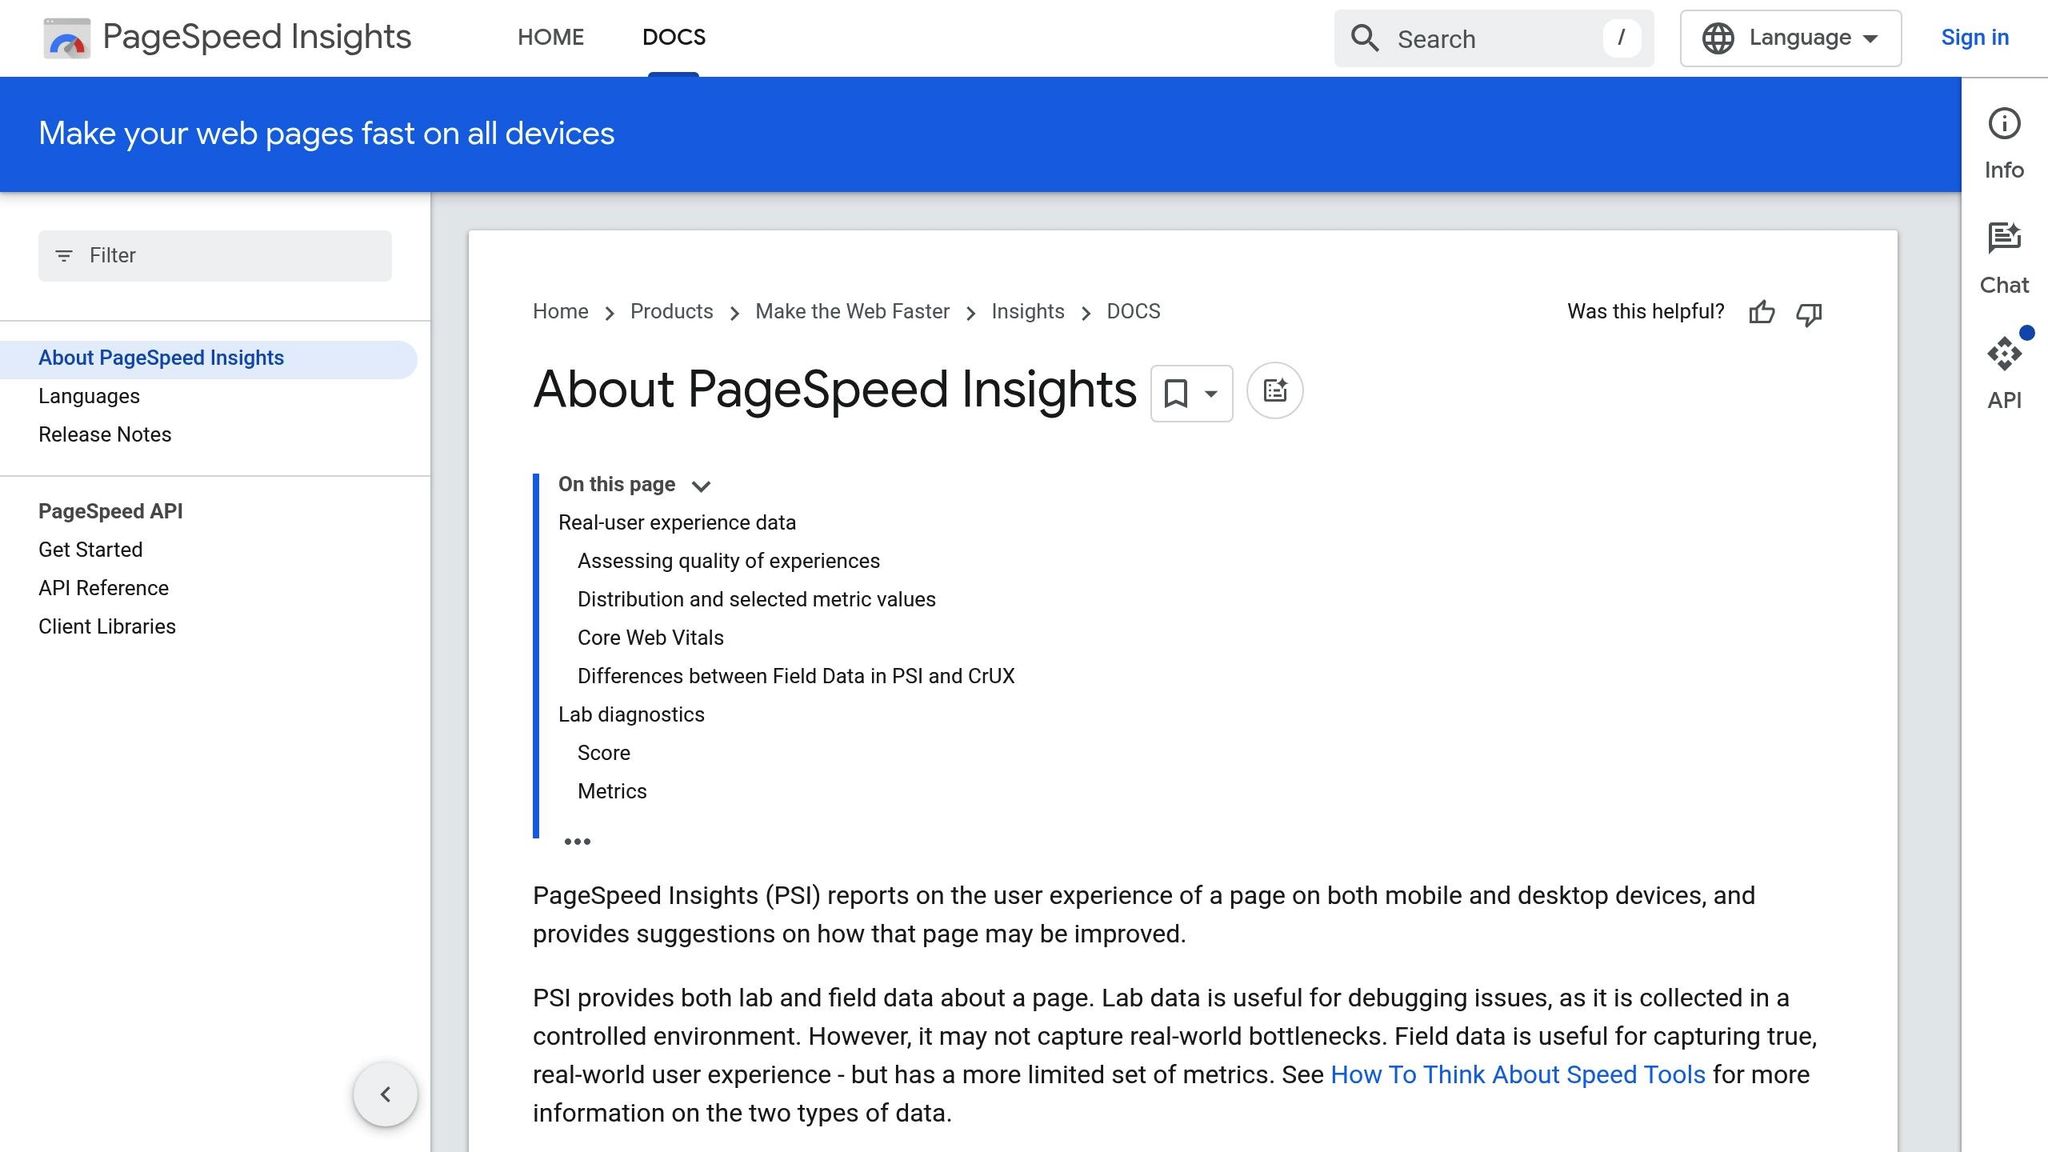
Start with Google PageSpeed Insights to uncover JavaScript execution issues. Simply input your website URL, and it will analyze performance for both mobile and desktop. Look for the "Reduce unused JavaScript" suggestions under the Opportunities section to identify scripts that might be slowing things down.
Lighthouse, the engine behind PageSpeed Insights, offers a detailed audit that flags JavaScript files taking longer than 2 seconds to execute. Meanwhile, GTmetrix dives deeper by measuring the execution time of each JavaScript file on your page. Both tools provide breakdowns by file, helping you zero in on the culprits causing delays.
"Reducing JavaScript execution time, in general, refers to decreasing the amount of time spent parsing, compiling, and executing JavaScript files." – GTmetrix
When reviewing performance reports, focus on these three metrics:
- Total Blocking Time (TBT): This metric captures how long JavaScript blocks the main thread, delaying user interactions. High TBT values can make your site feel unresponsive.
- JavaScript Execution Time: Aim to keep this under 2 seconds. Longer execution times can harm your Core Web Vitals scores.
- Unused JavaScript Percentage: This shows how much of the loaded code isn’t actually used, highlighting opportunities to optimize through code splitting or removal.
Once you’ve gathered these insights, it’s time to dig deeper and identify the specific scripts responsible for the delays.
Finding Scripts That Slow Down Your Site
Chrome DevTools is an essential tool for pinpointing problematic scripts.
- Track long tasks: Record a page load in Chrome DevTools and locate tasks that block the main thread for over 50 ms. These are marked with red triangles in the timeline, making them easy to spot.
- Detect unused code: Use the Coverage panel in Chrome DevTools to compare executed versus unused JavaScript.
- Evaluate WordPress scripts: If your site runs on WordPress, check theme and plugin JavaScript. Some scripts might load unnecessarily on every page. Use the Network panel to identify these scripts and assess their importance.
- Examine third-party scripts: Identify external scripts that can be deferred or removed. Filter by "JS" in the Network panel to see which third-party scripts are running.
"JavaScript execution time plays a central role in your page’s performance; a long JavaScript execution time may be detrimental to your site performance in several ways…" – GTmetrix
For sites built with frameworks like React or Vue, watch out for hydration issues. Hydration refers to the process where JavaScript attaches interactivity to server-rendered HTML. If this takes too long, you’ll notice a significant delay between the First Contentful Paint and when the page becomes interactive.
To improve Core Web Vitals, measure your full JavaScript bundle, identify nonessential scripts, isolate long tasks, and assess third-party code. These steps will help streamline your site’s performance.
5 Ways to Reduce JavaScript Execution Time
Once you’ve pinpointed the scripts causing delays, it’s time to take action. These strategies will help you cut down JavaScript execution time and improve your Core Web Vitals scores.
Minify and Compress JavaScript Files
Minification strips out unnecessary elements like spaces, comments, and line breaks from your JavaScript files, making them smaller and faster to load.
"Minifying JavaScript reduces the file size by removing unnecessary characters, such as spaces and comments. This makes pages load faster and can improve user engagement by providing a smoother browsing experience. Faster-loading pages may also enhance search engine rankings."
Minification alone can shrink file sizes by up to 60%. Pair it with compression methods like Gzip or Brotli for even faster downloads. Tools such as UglifyJS can handle minification automatically.
To enable compression, activate Gzip on your web server. This process compresses files before they’re sent to the browser, cutting down transfer times. Many Content Delivery Networks (CDNs) also offer built-in features for automatic minification and compression.
Use Defer and Async Attributes for Script Loading
By default, JavaScript blocks HTML parsing until it’s fully downloaded and executed. Adding defer or async attributes lets your page load more efficiently by handling scripts in the background.
- Use
asyncfor scripts that don’t rely on the DOM, like those for analytics or media loading. These scripts load in parallel with HTML parsing, but keep in mind they may execute in an unpredictable order. - Use
deferfor scripts that depend on the DOM or need to execute in sequence. This ensures they run in the correct order after the HTML is fully parsed.
Remove Unused JavaScript Code
Unused JavaScript adds unnecessary bulk, slowing down your site. As Ivan Palii, Head of Product at Sitechecker, explains:
"Unused JavaScript refers to loaded but unexecuted code that slows down web performance. Removing it improves load times, user experience, and SEO."
Start by auditing your site to identify essential scripts. Code splitting – breaking JavaScript into smaller chunks that load only as needed – can streamline performance. Regularly clean up unused plugins and libraries, and consider using a tag manager to better control third-party scripts. Always test changes to ensure everything still works as expected.
Lazy Load Third-Party Scripts
Third-party scripts, like those for analytics, chat widgets, and social media buttons, can hog resources. Lazy loading delays these scripts until they’re needed. For example, hold off on loading a chat widget until a user interacts with it, or postpone social media embeds until they scroll into view.
A good example is Google Analytics: instead of loading it synchronously, use the async attribute so it fetches alongside HTML parsing.
Write More Efficient JavaScript Code
Efficient coding can drastically reduce execution time without requiring a complete overhaul.
- Break large tasks into smaller chunks to avoid blocking the main thread. For instance, process 1,000 items in batches instead of all at once.
- Avoid repetitive DOM manipulations in loops. Instead, cache DOM references and group updates to minimize reflows and repaints. Using document fragments can also help when inserting multiple elements.
- Optimize event handling with debounce and throttle techniques for actions like scrolling or resizing. Event delegation is another useful approach, reducing memory usage and improving performance.
Testing Your JavaScript Optimizations
Once you’ve optimized your JavaScript, it’s crucial to test thoroughly to confirm those changes actually improve performance. This step ensures your updates enhance Core Web Vitals and catch any issues before they impact users.
Retesting with Lighthouse and SpeedVitals
Lighthouse is a go-to tool for immediate feedback on performance changes. Run it both before and after implementing optimizations to measure improvements in your performance scores. It also flags JavaScript issues, such as excessive reliance on polyfills or duplicate code, giving you actionable insights to refine further. For instance, using Chrome DevTools, you can block specific network requests to analyze how individual scripts affect Total Blocking Time (TBT). One example: blocking an unnecessary Intersection Observer polyfill boosted a site’s Lighthouse score from 63/100 to 70/100 and reduced TBT from 400ms to 300ms.
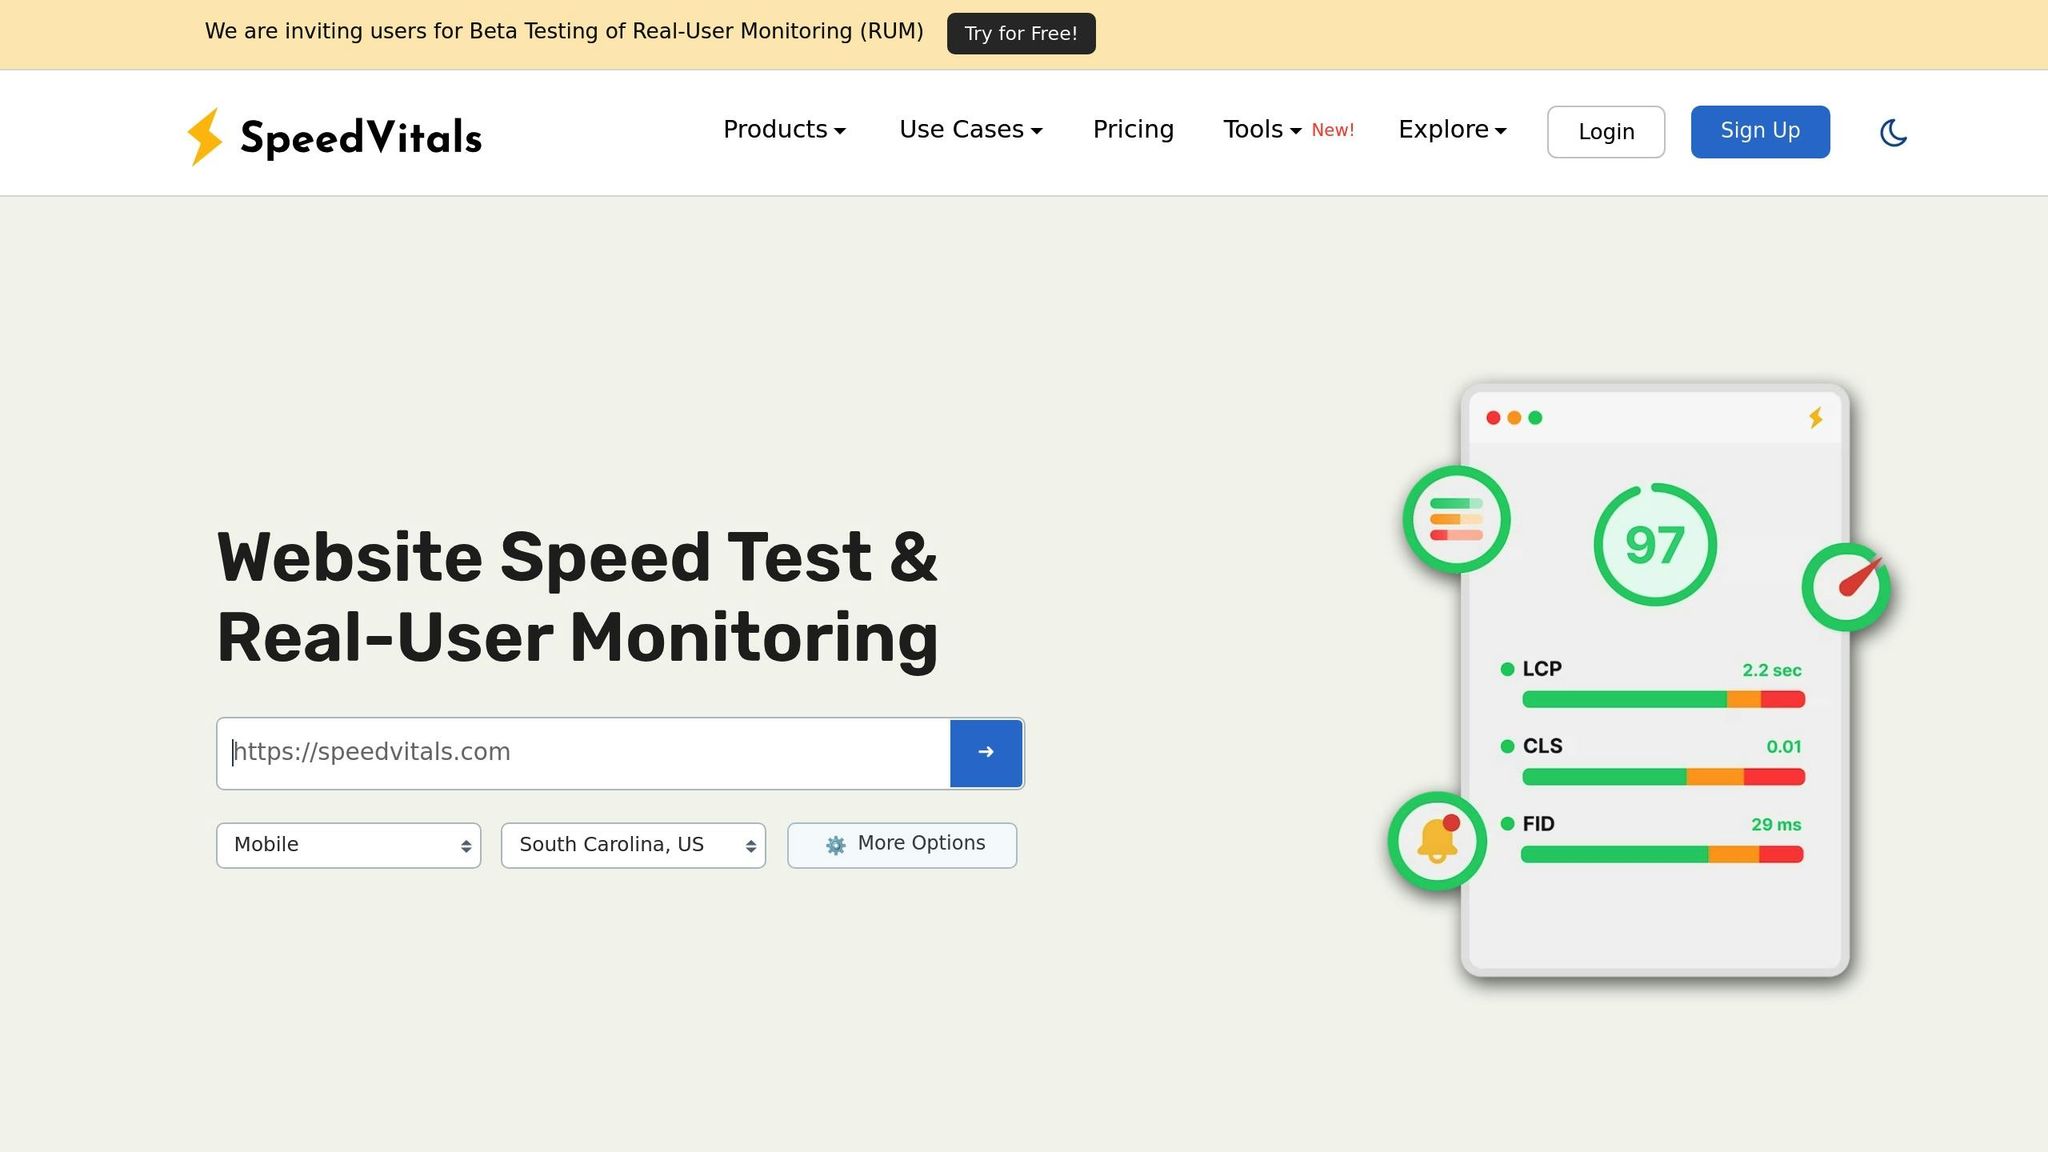
SpeedVitals offers additional insights that complement Lighthouse. It includes tools to visualize Cumulative Layout Shift (CLS) contributions via a specialized Core Web Vitals dashboard. You can also leverage third-party tools to monitor main-thread execution timelines, which reveal how your JavaScript changes impact interactivity. Finally, keep tracking Core Web Vitals trends to ensure your improvements have a lasting effect.
Tracking Core Web Vitals Over Time
Changes to Core Web Vitals often take time to reflect in real-user data. Focus on key metrics post-optimization: Largest Contentful Paint (LCP) should stay under 2.5 seconds, Interaction to Next Paint (INP) under 200 milliseconds, and Cumulative Layout Shift (CLS) below 0.1 .
Use tools like Google PageSpeed Insights, Lighthouse, and DebugBear for continuous monitoring . Real User Monitoring (RUM) is particularly valuable here, as it reflects how actual visitors experience your site, rather than relying solely on lab simulations . Setting up alerts can help you spot performance regressions early.
"Monitoring ensures that you can stay ahead of your Core Web Vitals scores for the long term."
Keep in mind that Lighthouse operates in a simulated environment, while Core Web Vitals rely on real-world data. Tools like PageSpeed Insights merge both lab and field data for a more comprehensive analysis. This explains why Lighthouse might show immediate improvements, but Core Web Vitals reports take time to catch up. Research shows that improving LCP by just 1 second can increase conversions by as much as 11%. Regular testing and monitoring ensure your JavaScript optimizations continue to enhance performance, benefiting both users and your search rankings.
JavaScript Optimization Methods Compared
Choosing the right optimization technique depends on your website’s requirements, technical expertise, and performance objectives. Here’s a breakdown of several methods, highlighting their benefits and potential risks to help you make informed decisions.
Pros and Cons of Each Optimization Method
Each optimization method comes with its own trade-offs. Understanding these will help you decide which ones to prioritize for your website.
| Method | Ease of Implementation | Potential Performance Gain | Risk of Breaking Functionality | Best Use Case |
|---|---|---|---|---|
| Minification | Very Easy | Low to Medium | Very Low | All websites – simple, effective, and safe |
| Defer/Async Loading | Easy | Medium to High | Low to Medium | Scripts that aren’t needed immediately |
| Removing Unused Code | Medium | High | Medium | Sites with excessive plugins or bloated themes |
| Lazy Loading Scripts | Medium | High | Low | Non-critical features like third-party widgets |
| Code Optimization | Hard | Very High | High | Custom applications with specific performance bottlenecks |
Minification is one of the easiest and safest ways to enhance performance. By stripping out unnecessary characters, it reduces file sizes significantly. When combined with server-side compression, it can cut data transfer sizes by up to 90%. The risk of breaking functionality is almost nonexistent, making it an excellent starting point for beginners.
Defer and async attributes are game changers for improving load times. The defer attribute delays script execution until after the HTML is fully parsed, while async executes scripts as soon as they’re downloaded. These techniques are especially effective for non-essential resources like analytics scripts or social media widgets.
Removing unused JavaScript code can lead to major performance improvements but requires careful execution. The main challenge is ensuring you don’t accidentally remove code that’s essential for specific features or pages.
Lazy loading third-party scripts prevents non-critical resources from loading until they’re actually needed. This method is particularly useful for elements like chatbots, social media feeds, and comment systems, reducing the initial load time without impacting user experience.
Optimizing JavaScript code offers the greatest performance boost but is also the most complex. This approach involves techniques like reducing DOM manipulations, optimizing loops, and implementing caching strategies. While the benefits can be huge, the risk of introducing bugs means this method is best left to experienced developers.
To put the importance of optimization into perspective, consider this: around 47% of users expect websites to load in under 2 seconds. Delays can lead to a 20% drop in conversions. On the flip side, even a 0.1-second improvement in load time has been shown to increase conversions by 8% and average order values by 9% on retail sites.
For the best results, use a combination of these techniques. Start with minification for quick, low-risk gains. Then, implement defer or async attributes for non-essential scripts. As you gain confidence, move on to removing unused code and lazy loading for more substantial improvements.
The key is finding the right balance between performance improvements and maintaining clean, manageable code.
Conclusion
Cutting down JavaScript execution time is a smart move that pays off. Right now, only 47% of websites meet the Core Web Vitals standards. And here’s a striking fact: just a 100-millisecond delay in page speed can lower conversion rates by 7%, while speeding things up by the same amount can boost them by up to 7%.
Take this example: a SaaS startup managed to increase trial sign-ups by 15% simply by cutting their Largest Contentful Paint (LCP) from 4.2 to 2.1 seconds. They did it using techniques like image compression, Gzip, and deferring non-critical JavaScript. As a bonus, their organic traffic grew by 18% month-over-month thanks to improved search rankings.
Staying on top of performance requires constant attention. Regular audits help identify problems early, and adopting new technologies like HTTP/3 can deliver 20–30% LCP improvements on mobile networks.
To build a lasting strategy, encourage collaboration between developers, designers, and content creators. Use tools like Google PageSpeed Insights, Lighthouse, and Search Console to conduct regular audits and maintain performance.
Optimizing Core Web Vitals isn’t just about better rankings – it’s about creating a smoother experience for users and driving more conversions. As user expectations continue to rise, ongoing improvements are a must.
Start simple by minifying JavaScript and deferring non-critical scripts. From there, tackle more advanced techniques. These steps not only enhance user experience but also strengthen search rankings and, ultimately, revenue.
For more tailored advice on boosting your website’s performance and visibility, check out the resources available at SearchX.
FAQs
How can I identify which JavaScript files are slowing down my website?
To identify JavaScript files slowing down your site, Chrome DevTools is a great tool. Head to the Performance tab, where you can record and examine script execution times. Pay close attention to long tasks – these are often the culprits behind delayed page loads.
You can also use the JavaScript Performance API to measure how long specific scripts take to run. This can give you more detailed insights into areas that need improvement.
Tackling these performance bottlenecks can boost your site’s Core Web Vitals, leading to quicker load times and a smoother user experience.
What’s the difference between the ‘defer’ and ‘async’ attributes in script loading, and when should you use each?
The ‘defer’ and ‘async’ attributes determine how scripts are loaded and executed in your web page, with their main difference being the timing of execution and how they interact with HTML parsing:
- ‘Async’ allows the script to download while the HTML is being parsed and executes it immediately once it’s ready. This can pause the parsing process, making it a good choice for scripts like analytics or ads that don’t rely on other scripts or the DOM.
- ‘Defer’ also downloads the script alongside HTML parsing but waits to execute it until the entire HTML is fully parsed. It ensures scripts run in the correct order, which is ideal for scripts that depend on the full HTML structure or need to maintain a specific execution sequence.
In short, use ‘async’ for scripts that function independently and ‘defer’ for those that rely on the complete HTML or other scripts.
How does reducing JavaScript execution time improve my website’s performance and search rankings?
Reducing JavaScript execution time can dramatically improve your website’s performance. Faster load times, fewer delays in user interactions, and less main-thread blocking all contribute to a smoother browsing experience. And let’s face it – when your site runs smoothly, visitors are far more likely to stick around, engage with your content, and avoid hitting that back button.
But it’s not just about keeping users happy. Search engines like Google value speed and usability. By optimizing how JavaScript runs on your site, you’re also improving your Core Web Vitals – metrics that Google uses to measure user experience. Better scores here can mean higher rankings in search results, which translates to more traffic headed your way.