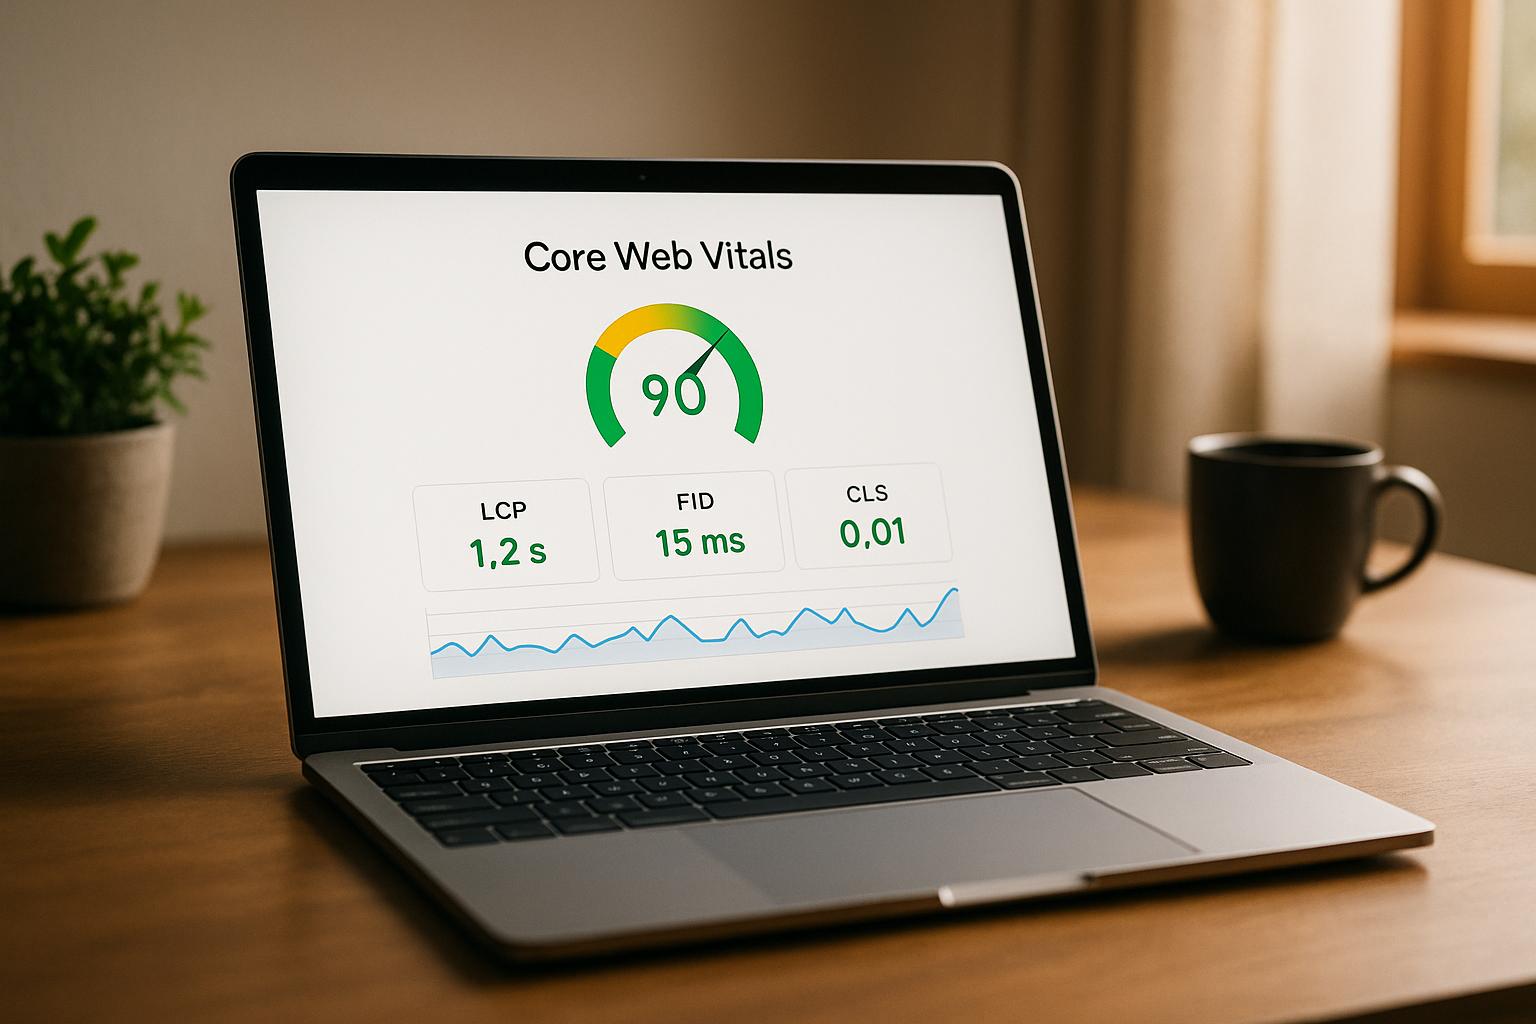
Client-Side Rendering (CSR) can hurt your site’s Core Web Vitals – LCP, INP, and CLS – if not optimized. These metrics directly impact search rankings and user experience. Here’s the quick takeaway:
- LCP (Largest Contentful Paint): CSR delays content rendering due to JavaScript execution and API calls, often causing blank screens or slow load times.
- INP (Interaction to Next Paint): Heavy JavaScript blocks responsiveness, making interactions feel sluggish.
- CLS (Cumulative Layout Shift): Dynamic content loading causes layout instability, frustrating users.
How to fix it? Start by profiling CSR performance to identify bottlenecks. Use tools like Chrome DevTools, Lighthouse, or PageSpeed Insights to analyze JavaScript execution, layout shifts, and interaction delays. Then, optimize by:
- Reducing JavaScript size (code splitting, tree shaking, lazy loading).
- Improving responsiveness (breaking tasks, using Web Workers, debouncing events).
- Stabilizing layouts (reserving space for images, optimizing font loading).
Regular monitoring ensures these fixes stick. When done right, profiling CSR can transform your site’s performance and user satisfaction.
How CSR Affects Each Core Web Vital
Largest Contentful Paint (LCP) in CSR
Client-Side Rendering (CSR) can significantly delay the Largest Contentful Paint (LCP) because of its multi-step loading process. Instead of immediately displaying content, CSR first downloads a basic shell, then fetches and executes JavaScript before rendering anything meaningful. This often leads to blank screens or loading spinners, pushing LCP beyond Google’s recommended thresholds.
The situation worsens with large JavaScript bundles, which take longer to download, especially on slower connections or low-end devices. Additionally, CSR applications that rely on API calls for fetching data introduce further delays in rendering the largest visible element. This can leave users waiting longer for the main content to appear. Let’s now look at how JavaScript-heavy operations affect responsiveness and Interaction to Next Paint (INP).
Interaction to Next Paint (INP) Response Issues
CSR applications often struggle with Interaction to Next Paint (INP) because heavy JavaScript operations can clog the main thread. When users interact with elements on the page, their actions might be delayed if the browser is busy executing scripts. Since the browser uses a single thread for these tasks, this creates a bottleneck.
Moreover, complex state management in CSR apps can trigger multiple updates, further burdening the main thread. Third-party scripts – like those used for analytics or live chat – can make matters worse if not optimized, adding to the thread’s workload. Long-running single-page applications may also experience memory management hiccups, leading to brief pauses and noticeable interaction delays. Next, we’ll explore how incremental content loading in CSR impacts Cumulative Layout Shift (CLS).
Cumulative Layout Shift (CLS) Problems
CSR can lead to Cumulative Layout Shift (CLS) issues due to the way content loads incrementally. As JavaScript executes and API data arrives, new elements are dynamically inserted into the layout. If enough space isn’t reserved ahead of time, these insertions can push existing elements, causing unexpected shifts.
This problem is compounded by dynamic content, which often rearranges elements. Delayed font loading or images without predefined dimensions can also contribute to layout instability. Additionally, when components are mounted or unmounted – during route changes or modal interactions – small shifts can occur repeatedly, adding up to a high CLS score. These layout disruptions can make the user experience feel jarring and unpredictable.
How to fix Largest Contentful Paint (LCP) with Brian Jackson of Perfmatters
Tools and Methods for Profiling CSR Performance
Profiling CSR performance is essential for improving Core Web Vitals scores. Knowing which tools to use and how to apply them effectively can turn guesswork into precise optimization.
CSR Profiling Tools
Chrome DevTools is a powerful resource for analyzing CSR performance. Its Performance tab tracks JavaScript execution, rendering, and network activity. It pinpoints when your largest contentful paint (LCP) occurs and highlights scripts that block the main thread. Additionally, the Lighthouse panel within DevTools allows you to run Core Web Vitals audits directly in your development environment.
Lighthouse automates Core Web Vitals audits in both lab and field conditions. It provides detailed reports with actionable recommendations. By simulating various network speeds and device capabilities, Lighthouse helps you understand how your app behaves under slower conditions.
Web Vitals Extension adds LCP, INP, and CLS scores to your browser toolbar, updating them as you navigate through pages. This tool is particularly useful for quick checks during development and testing.
PageSpeed Insights blends lab data from Lighthouse with real user metrics from the Chrome User Experience Report. This combination offers insights into both controlled testing scenarios and how your CSR application performs for real users across different devices and networks.
Each of these tools provides unique insights, making them invaluable for effective CSR profiling.
How to Profile CSR Performance
Once you’ve chosen your tools, follow these steps to profile your CSR performance:
- Start with Chrome DevTools. Open the Performance tab, click the record button, and refresh your page to capture a full loading trace. After the page loads completely, stop recording and analyze the timeline. Look for tasks lasting over 50 milliseconds, as these can cause INP problems in CSR applications.
- Focus on the Main Thread. Examine the timeline for long tasks, indicated by red triangles. Expand these sections to identify specific functions or libraries consuming the most processing time. Framework-related tasks, such as React rendering or Vue component mounting, are common culprits for delayed LCP.
- Check Resource Loading. Use the Network tab to analyze resource loading patterns. Sort requests by size and load time to spot large JavaScript bundles that may delay rendering. Enable the Coverage tab to see which portions of your JavaScript code are actually used during page load – unused code signals optimization opportunities.
- Monitor CLS and INP. Enable paint flashing in the Rendering tab to visualize layout shifts in real time. Record interactions to capture INP-related issues. The Performance tab will show when layout shifts occur and which DOM changes triggered them.
Tool Comparison Chart
To help you decide which tool suits your needs, here’s a quick comparison:
| Tool | Usability | Metrics Depth | Real User Data | Integration |
|---|---|---|---|---|
| Chrome DevTools | Medium | Comprehensive | No | High |
| Lighthouse | High | Detailed | No | High |
| Web Vitals Extension | High | Basic | No | Medium |
| PageSpeed Insights | High | Moderate | Yes | Medium |
Chrome DevTools offers deep insights but requires technical expertise. It’s ideal for diagnosing specific performance bottlenecks and tracing JavaScript’s impact on Core Web Vitals.
Lighthouse strikes a balance between usability and detailed reporting, making it great for regular audits and optimization planning.
Web Vitals Extension is perfect for quick checks during development but lacks the depth needed for more complex analyses.
PageSpeed Insights stands out by combining lab testing with real user data, helping you validate whether your optimizations improve performance for actual visitors.
Use Chrome DevTools for in-depth diagnostics, Lighthouse for comprehensive audits, the Web Vitals Extension for ongoing monitoring, and PageSpeed Insights to ensure your efforts lead to measurable improvements for real users.
sbb-itb-880d5b6
CSR Optimization Methods for Better Scores
Once you’ve pinpointed performance bottlenecks through profiling, it’s time to tackle them head-on. The strategies below address common issues that lead to poor Core Web Vitals scores in client-side rendered (CSR) applications.
Reducing JavaScript File Sizes
One of the most impactful ways to optimize your application is by shrinking JavaScript bundle sizes. Here’s how:
- Code splitting: Instead of loading your entire application upfront, divide it into smaller chunks that load as needed. In React, you can use
React.lazy()for dynamic imports, while Vue supports route-based code splitting. For instance, an e-commerce product page doesn’t need checkout-related JavaScript immediately. By splitting code at the route level, you can drastically reduce the initial bundle size. - Tree shaking: This technique removes unused code from your final bundle. Tools like Webpack and Vite can automatically handle this when imports are structured properly. For example, import only the specific Lodash functions you need, rather than the entire library.
- Lazy loading: Defer loading non-critical components, such as images, videos, or below-the-fold content, until they’re actually needed. The Intersection Observer API makes this easy to implement without relying on extra libraries.
- Preloading critical resources: Use the
<link rel="preload">tag to fetch essential JavaScript files early in the loading process. This can significantly improve your Largest Contentful Paint (LCP) score by ensuring key resources are ready when needed.
Making Pages More Responsive
Once JavaScript file sizes are under control, the next step is to optimize the main thread workload. This is crucial for improving interactivity and achieving better Interaction to Next Paint (INP) scores.
- Break up large tasks: Long-running JavaScript blocks user interactions. Use techniques like time slicing or
scheduler.postTask()to break these tasks into smaller chunks. - Debounce and throttle event handlers: For frequent events, such as typing in a search bar, debouncing delays execution until the user pauses, while throttling limits how often a function runs. Tuning these intervals can balance responsiveness and performance.
- Web Workers: Offload heavy computations, like data processing or image manipulation, to Web Workers. This keeps the main thread free for user interactions. While implementing Web Workers may require architectural adjustments, they’re especially useful for applications dealing with large datasets or real-time calculations.
- Event delegation: Instead of attaching event listeners to multiple elements, use a single listener on a parent container and handle interactions through event bubbling. This reduces memory usage and improves responsiveness.
- Framework-specific optimizations: Use tools like
useMemo()anduseCallback()in React, orv-memoin Vue, to optimize rendering. For Angular applications, the OnPush change detection strategy can reduce unnecessary updates.
Preventing Layout Shifts
Stabilizing your layout is key to minimizing Cumulative Layout Shift (CLS) and ensuring a smooth user experience.
- Reserve space for images and containers: Define fixed dimensions for images and dynamic containers to prevent unexpected shifts.
- Optimize font loading: Use
font-display: swapto display fallback fonts while custom fonts load. Preload critical font files to ensure they’re available early in the page load process. - Avoid inserting content above existing elements: If you must add new content higher on the page, consider animating the transition to make it less jarring. Otherwise, add new content at the bottom or replace elements of the same size.
- Test under slow network conditions: Simulate slow 3G connections in Chrome DevTools to catch layout shifts that might only appear on poor connections.
Optimization Impact Summary
Each optimization strategy affects Core Web Vitals differently. Here’s a quick breakdown:
| Strategy | LCP Impact | INP Impact | CLS Impact |
|---|---|---|---|
| Code Splitting | High | Low | None |
| Lazy Loading | High | Medium | None |
| Tree Shaking | Medium | Low | None |
| Web Workers | Low | High | None |
| Event Delegation | None | High | None |
| Image Sizing | None | None | High |
| Font Loading | Medium | None | Medium |
| Container Sizing | None | None | High |
- LCP improvements: Focus on reducing bundle sizes with code splitting and lazy loading.
- INP improvements: Prioritize reducing main thread work using Web Workers and event delegation.
- CLS improvements: Reserve space for images and containers, and load content carefully to avoid unexpected shifts.
Monitoring and Improving Performance Over Time
As new features and updates roll out, it’s common for CSR performance to take a hit. To keep your Core Web Vitals in good shape, it’s essential to establish a regular monitoring process. This ensures that earlier optimizations continue to deliver results over time.
Setting Up Automated Monitoring
Once you’ve implemented specific optimizations, it’s important to keep an eye on performance to spot new issues as they arise. Automated Real User Monitoring (RUM) tools are great for this – they collect data from real users across various devices, networks, and locations. Tools like SpeedCurve provide detailed, real-world insights into how Core Web Vitals behave over time and across different conditions.
Using User Feedback for Improvements
While automated metrics are incredibly useful, they don’t always tell the whole story. Direct feedback from users helps you understand the actual impact of performance issues. Tools like New Relic and Dynatrace offer real-time data on user interactions, giving you a clearer picture of what might need fixing.
Additionally, embedded feedback polls and support tickets can uncover issues that automated tools might overlook. These insights help you address problems that truly matter to your users.
Conclusion: Better Core Web Vitals Through CSR Profiling
Profiling client-side rendering (CSR) goes beyond being a purely technical task – it’s a deliberate strategy that can significantly influence your website’s search rankings and the satisfaction of your users. Optimizing Core Web Vitals requires ongoing assessment and fine-tuning.
With existing profiling tools, you can gather both lab and field data to get a well-rounded understanding of your CSR performance. These insights highlight where focused improvements can make the biggest difference.
For example:
- Improving LCP (Largest Contentful Paint): Focus on reducing Time to First Byte (TTFB) and optimizing critical content elements.
- Enhancing INP (Interaction to Next Paint): Use flame charts to identify and address long-running tasks.
- Reducing CLS (Cumulative Layout Shift): Monitor layout shifts closely with specialized tools to ensure visual stability.
One effective approach is integrating automated profiling into your CI pipeline. This helps catch performance regressions early and ensures consistent results across different devices and network conditions.
It’s important to remember that CSR optimization isn’t a one-and-done process. As you introduce new features or update your codebase, performance can slip without regular attention. By combining proactive monitoring, continuous profiling, and feedback from real users, you can create a reliable system that sustains strong Core Web Vitals scores over time. This ongoing effort not only supports your search rankings but also delivers a better experience for your users.
FAQs
How does client-side rendering (CSR) affect Core Web Vitals metrics like LCP, INP, and CLS?
Client-side rendering (CSR) has a notable impact on Core Web Vitals metrics:
- Largest Contentful Paint (LCP): With CSR, LCP can be delayed because the browser needs to load and execute JavaScript before it can render critical content. This often increases the time users perceive as the page load time.
- Interaction to Next Paint (INP): INP can struggle when CSR leads to longer processing times, particularly if the Document Object Model (DOM) becomes overly large or complex, slowing down interactivity.
- Cumulative Layout Shift (CLS): CSR’s dynamic content and late-loading elements can cause unexpected layout changes, which negatively affect CLS scores.
To address these challenges, you can use techniques like code-splitting, prerendering, and simplifying the DOM. These adjustments can lead to a faster, more stable, and smoother experience for users.
What are the best tools and techniques to profile client-side rendering (CSR) and improve Core Web Vitals scores?
To improve Core Web Vitals scores using client-side rendering (CSR) profiling, tools like Chrome DevTools and Lighthouse are your go-to options. These tools allow you to dig into key metrics like Largest Contentful Paint (LCP) and First Input Delay (FID), helping you spot performance roadblocks and areas that need attention.
For data grounded in actual user experiences, Google Search Console offers insights into Core Web Vitals metrics collected from real-world users. By combining this data with code profiling techniques, you can identify and fix rendering delays. The focus should be on optimizing critical rendering paths, cutting down JavaScript execution time, and reducing layout shifts to deliver smoother performance and improve your scores.
How can I optimize JavaScript in client-side rendering (CSR) to improve responsiveness and layout stability?
To improve responsiveness and maintain layout stability in CSR (Client-Side Rendering) applications, it’s essential to limit unnecessary JavaScript execution during page load and streamline how the DOM is accessed and updated. This helps prevent layout shifts caused by forced reflows or layout thrashing, leading to a smoother user experience.
Avoid injecting content late in the loading process and prioritize CSS-based layouts over JavaScript-heavy alternatives. CSS provides more predictable and stable results, ensuring fewer disruptions. These adjustments not only enhance usability but also boost Core Web Vitals metrics like Cumulative Layout Shift (CLS), which are critical for overall performance.